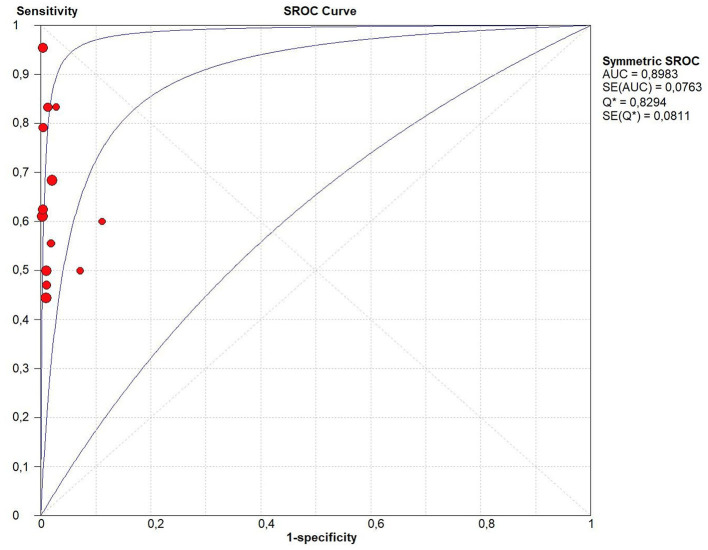
Figure 3.
Summary receiver operating characteristic (SROC) curve of the diagnostic accuracy of Xpert MTB/RIF Ultra assay for tuberculosis detection. In this figure, the blue lines represent the AUC (central line) with its 95% CI (external lines) calculated with a meta-analytic approach, while red dots represent the sensitivity and specificity data for each study.

