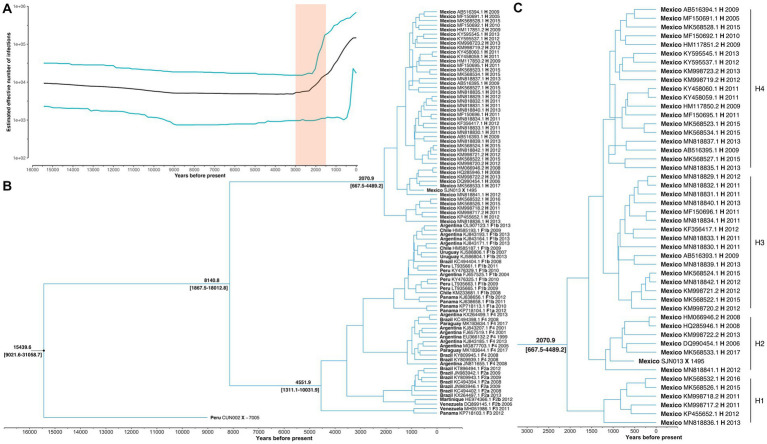
Figure 2.
Main results of the Bayesian skyline analysis. (A) Reconstruction of HBV infections in the last 15,000 years. T = 0 indicates the year 2017, which was the most recent collection date. While the shaded area highlights a period of rapid growth in the number of HBV infections. (B) Phylogenetic tree showing the evolutionary history of genotype H. Values at nodes indicate the time of Most Recent Common Ancestor (TMRCA). Each sample is named with its country of origin, ID access, genotype/sub-genotype, and collection date. (C) The TMRCA of the genotype H and values in brackets represent 95% highest posterior density interval of the estimation. Letters (H1-H4) indicate the main diversification events of genotype H since its origin in Mexico.

