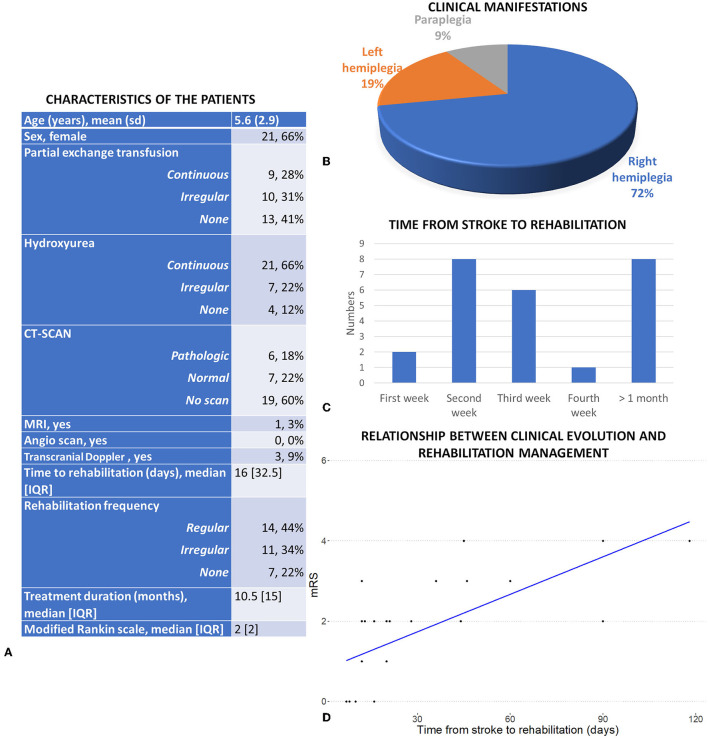
Figure 1.
(A) Clinical characteristics of the patients and complementary examination. (B) Clinical manifestation of the 32 included patients. (C) Repartition of the average time from stroke to treatment. (D) Relationship between the clinical evolution and the time from stroke to rehabilitation services (after adjustment for frequency, duration of the rehabilitation and age).

