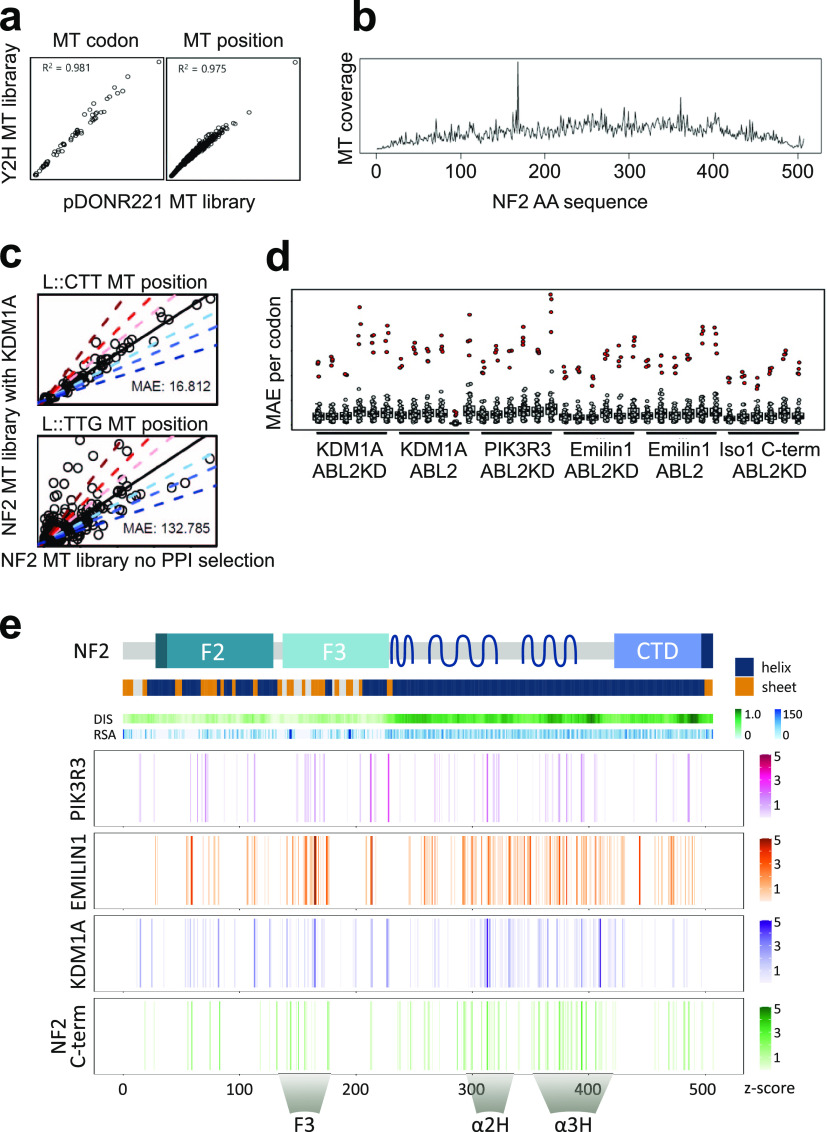
Figure 2. Deep mutational NF2 interaction perturbation.
(A) Number of mutant reads from the mutant NF2-Iso7 library in pDONR221 (library cloning vector) and pBTM116-D9 (Y2H vector). The axes represent the number each mutation was sequenced for a codon (left) or for a NF2 position (right). (B) Mutational sequence coverage (number of mutant reads) of the NF2 mutant library across the NF2 amino acid sequence. (C) Example of the recall statistics of the rY2H selection with NF2-KDM1A enrichment of a non-programmed mutant codon (L::CTT) and a programmed mutant codon (L::TTG, right) after rY2H selection of mutant library NF2 isoform 7 through interaction with WT KDM1A across all positions within NF2. Enrichment of reads in comparison with the NF2 MT library for a set of programmed (L::TTG) mutations is observed as deviation from a linear model (mean absolute error MAE = 132). (D) Overall results for all PPI samples. Deviation from codon-specific linear models (MAE: PPI versus NF2 library) of the programmed amino acid mutations (red dots) is much larger than of any other mutations (grey dots). MAE values of all codons for all 36 protein interactions sequenced are shown. (E) rY2H interaction perturbation profiles. Schematic of NF2-Iso7 protein, domain structure with structure (helix/sheet), disorder prediction (DIS), and solvent accessibility predictions (RSA). Aligned, combined enrichment profiles of the four interactions are shown. Sequence position interfering with the NF2-Iso7 interaction is color coded (Z-score). The PIK3R3 profile represents a combination of two biological replicas assayed in the presence of ABL2, the NF2 C-term profile combines two experiments with ABL2KD. KDM1A and EMILIN1 profiles contain a combination of four biological replicas (each two with ABL2 and two with ABL2KD). Mutational cluster regions are highlighted as F3, α2H, and α3H.

