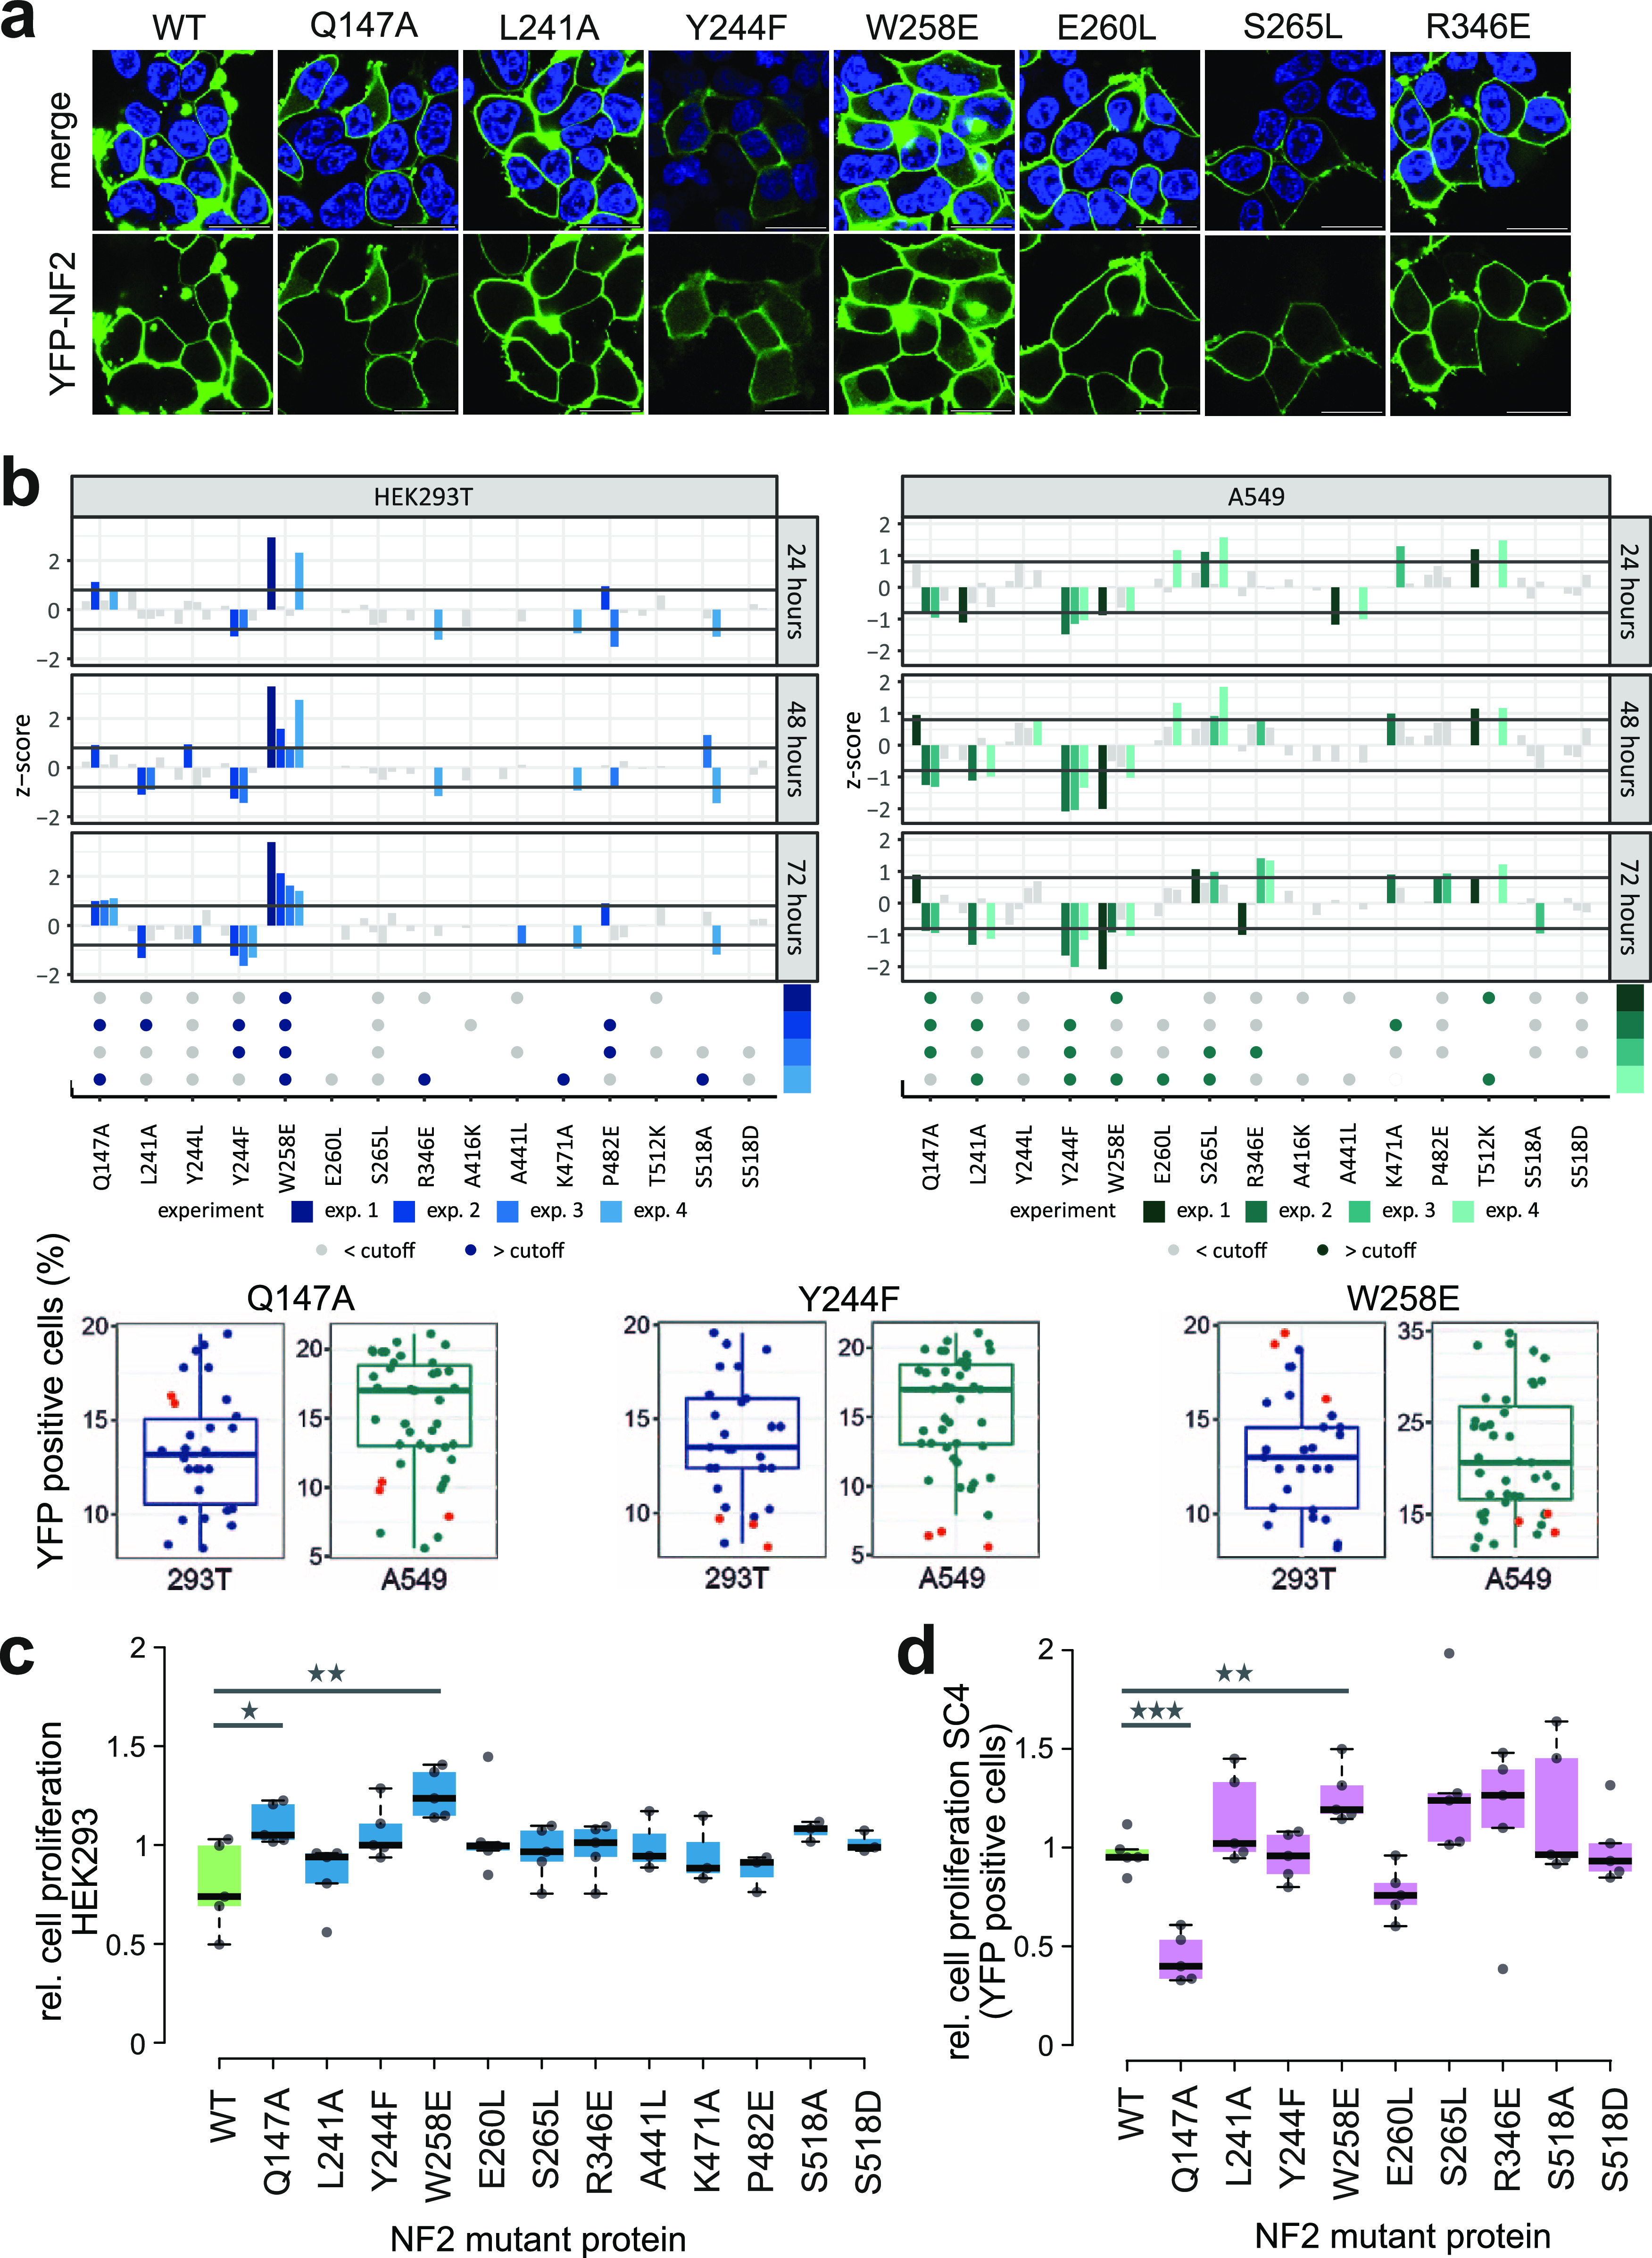
Figure 5. Impact of NF2 variants on cell proliferation.

(A) Confocal fluorescence microscopy images of WT and selected NF2 variants. HEK293T cells were transiently transfected with N-terminal YFP-tagged NF2 (green) and cellular localization of NF2 proteins 24 h after transfection was investigated by confocal fluorescence microscopy. Nuclei were stained with Hoechst (blue). Top, merge of Hoechst and YFP, bottom, YFP signal from NF2 expression at the membrane. Scale bar = 20 μM. Full set of variants see Fig S4. (B) FACS-based proliferation analyses of HEK293T and A549 cells expressing YFP-tagged NF2 proteins. Cells were transiently transfected with plasmids expressing YFP-tagged NF2 WT and mutant versions and the relative fraction of YFP-positive cells was determined over a time period of 3 d. Individual experiments were performed as triplicates, each NF2 mutant versions was tested in up to four experiments. Upper panel: Z-scores were calculated and variants below or above the cutoffs of −0.8 or 0.8 were colored according in each experiment. Dots: constructs which exceeded the cutoff on two individual timepoints in one experiment were colored in blue, variants below the cutoff are colored in grey. Lower panel: examples of individual experiments where the fraction of YFP-positive cells at 48 h is shown. Data points of the Q147A, Y244F, and W258E NF2 variants are shown as red dots, respectively, blue dots show the distribution of all other NF2 protein variants in the experiment. (C) Live cell imaging of HEK293 transiently transfected with N-terminal YFP-tagged NF2 variants. Relative cell proliferation is calculated as area of cell confluency over select time intervals between 16 h and 64 h after transfection and normalized to the median cell proliferation of all NF2 constructs. Box plots represent the average of triplicate measurements of five experiments. Statistically significant differences (t test, * = P < 0.05; ** = P < 0.01) to WT NF2 are indicated. (D) Live cell imaging of SC4 NF2−/− cells transiently transfected with N-terminal YFP-tagged NF2 variants. Relative cell proliferation is calculated as the area of cell confluency of YFP-positive cells over select time intervals between 12 h and 40 h after transfection and normalized to the median cell proliferation of all NF2 constructs. Box plots represent the average of triplicate measurements of five experiments. Statistically significant differences (t test, ** = P < 0.01; *** = P < 0.001) to WT NF2 are indicated.
