
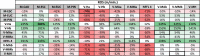
Table 5.
Crosstabulation matrix that assesses the impact of fuel models misclassification in the simulated rate of spread (ROS). Color scheme ranges from dark red (underestimation) to dark green (overestimation). Interpretation, for example for the largest underestimation (-74 %) is: an incorrect classification of the fuel model class of M-ESC when it should be V-Ha, represents an underestimation of the ROS of 74 %. Columns are the correct fuel model class, while lines are the mapped fuel model class.
 |