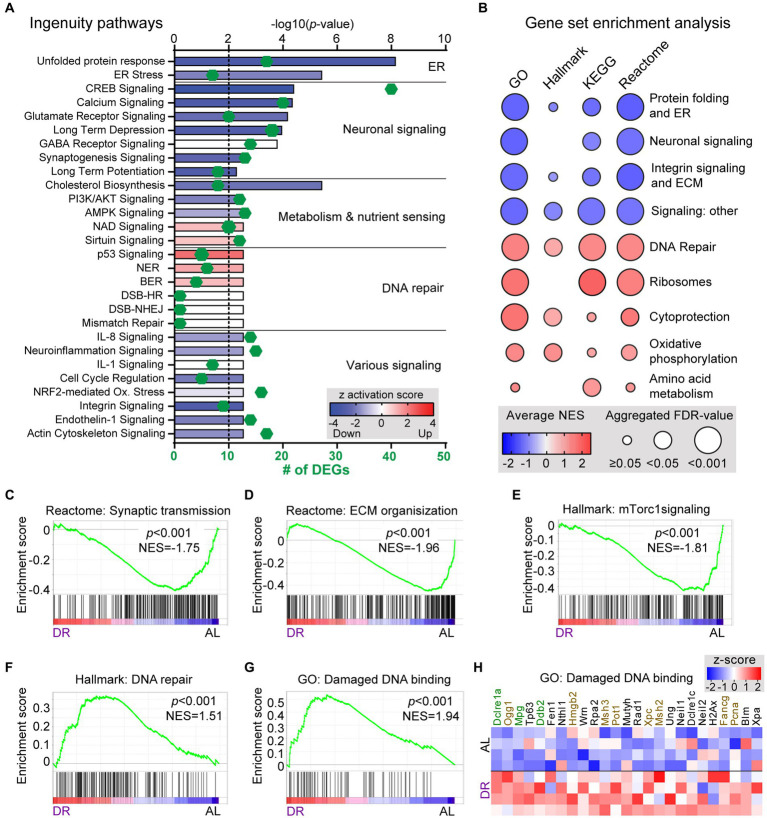
Figure 2.
Pathway and GSEA analysis of the effect of DR on cerebellar transcriptome. (A) Selection of significantly altered pathways of DEGs as identified with Ingenuity Pathway Analysis. Length of bars indicate the −log10(p-value) with the dashed line at p = 0.01. Color of bars (z-score) indicates whether and to which degree pathways are up- (red) or down-regulated (blue). Green diamonds show the number of DEGs associated with the pathway. (B) Graph showing summary of results of gene set enrichment analysis (GSEA) with all gene sets from Hallmark, KEGG and Reactome canonical pathways, and Gene Ontology (GO) collections. The graph is based on gene sets with p < 0.05 and FDR < 0.25 categorized as outlined in Supplementary Table S3. (C–E) Exemplary GSEA graphs illustrating enrichment of down-regulated genes in gene sets associated with synaptic transmission (C), extra cellular matrix (D), and mTorc1 signaling (E) in DR cerebellar cortex. (F–H) GSEA graphs (F,G) and heat map [(H) with z-scores of genes of (G)] illustrating enrichment of up-regulated genes in gene sets associated with DNA repair pathways in DR cerebellum. In (H) genes in green and brown have FDR and p values <0.05, respectively.

