Figure 4.
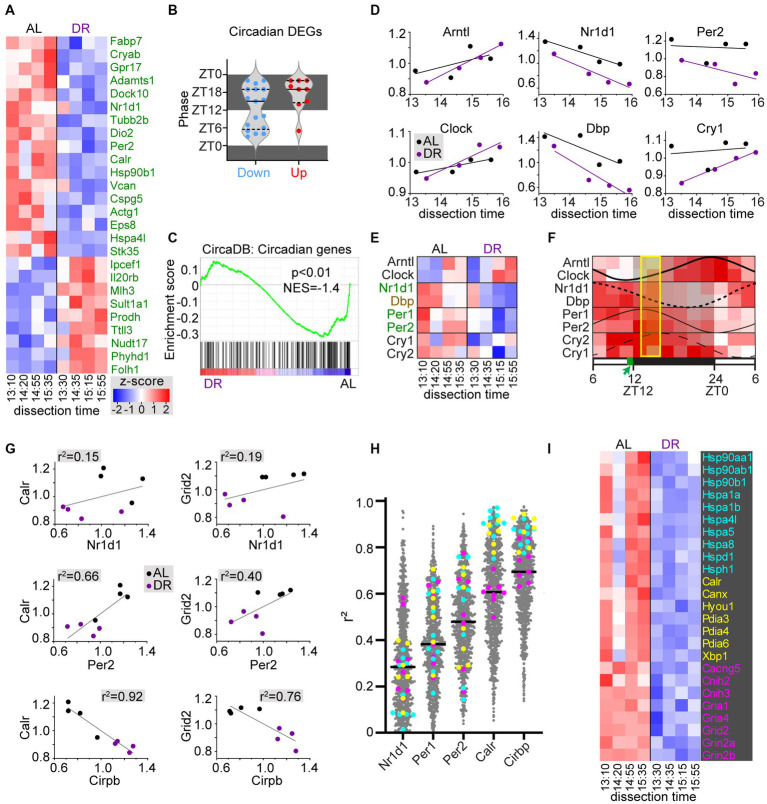
DR induces changes in circadian cerebellar genes and heat shock chaperones. (A,B) Heatmap (A) and bar graph with peak phases (B) of differentially expressed circadian genes in DR versus AL cerebellar cortex. Dissection time [x-axis in (A)] is indicated as zeitgeber time (ZT). (C) GSEA plot of cerebellar circadian genes (i.e., genes from CircaDB mouse cerebellar database with JTK q-value < 0.05) in DR versus AL cerebellar cortex. (D–F) x-y plots (D) and heat map (E) of core clock genes expression related to time of dissection show that changes in core clock gene expression throughout the dissection period in both AL and DR cerebellum are consistent with oscillation phases of core clock gene expression in cerebellum as illustrated in panel (F) that is based on Supplementary Figure S5 of Zhang et al. (2014). Genes in green and brown have FDR < 0.05 and p < 0.05, respectively in DR versus AL comparison. The yellow box in (F) indicate the period of dissection (ZT13–ZT16), and the green box in the time bar indicates the time of daily food delivery to DR animals. (G) x-y plots with linear correlation lines (G) illustrate a poor correlation between sample values of 2 exemplary DEGs (Calr and Grid2) and differentially expressed core clock genes Nr1d1 and Per2. Instead, Calr values show a strong negative correlation with the hypothermia-induced factor Cirbp that shows increased expression in DR cerebellum. Further linear correlation analysis of all DEGs [grey dots in (H)] versus differentially expressed core clock genes and Cirbp, indicates stronger correlations with Cirbp compared than with Nr1d1, Per1, and Per2, in particular for all differentially expressed heat shock proteins [cyan in (H,I)], and ER chaperones [yellow in (H,I)]. Genes in pink in (H,I) are glutamate receptor subunits and adaptors.

