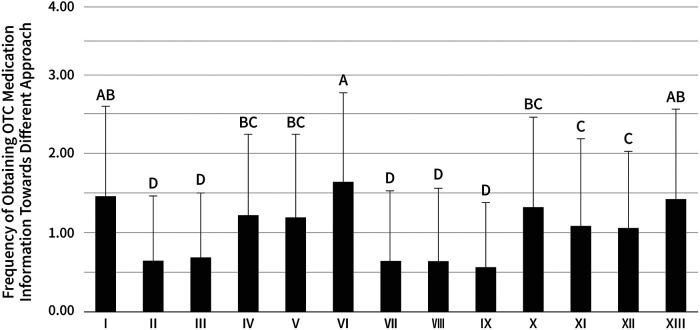
Figure 4.
Frequency of approaches preferred in collecting information on OTC medicine. The approaches are: (I) TV advertisement (1.47 ± 1.14), (II) Newspaper advertisement (0.64 ± 0.83), (III) magazine advertisement (0.68 ± 0.81), (IV) Internet advertisement (1.22 ± 1.03), (V) Website of a pharmaceutical manufacturer (1.19 ± 1.05), (VI) Internet search engines (e.g., Yahoo! and Google) (1.65 ± 1.14), (VII) Side effect databases of the PDMA (0.64 ± 0.89), (VIII) Academic societies (e.g., Japan Pharmaceutical Association) (0.65 ± 0.91), (IX) private sector (e-pharma) (0.57 ± 0.81), (X) pharmacists (1.33 ± 1.14), (XI) Doctors (1.10 ± 1.10), (XII) Friends (1.06 ± 0.97), (XIII) Family (1.42 ± 1.15). The same letter indicates that the difference is not significant (p > 0.05), and different letters indicate a significant difference (p < 0.01).

