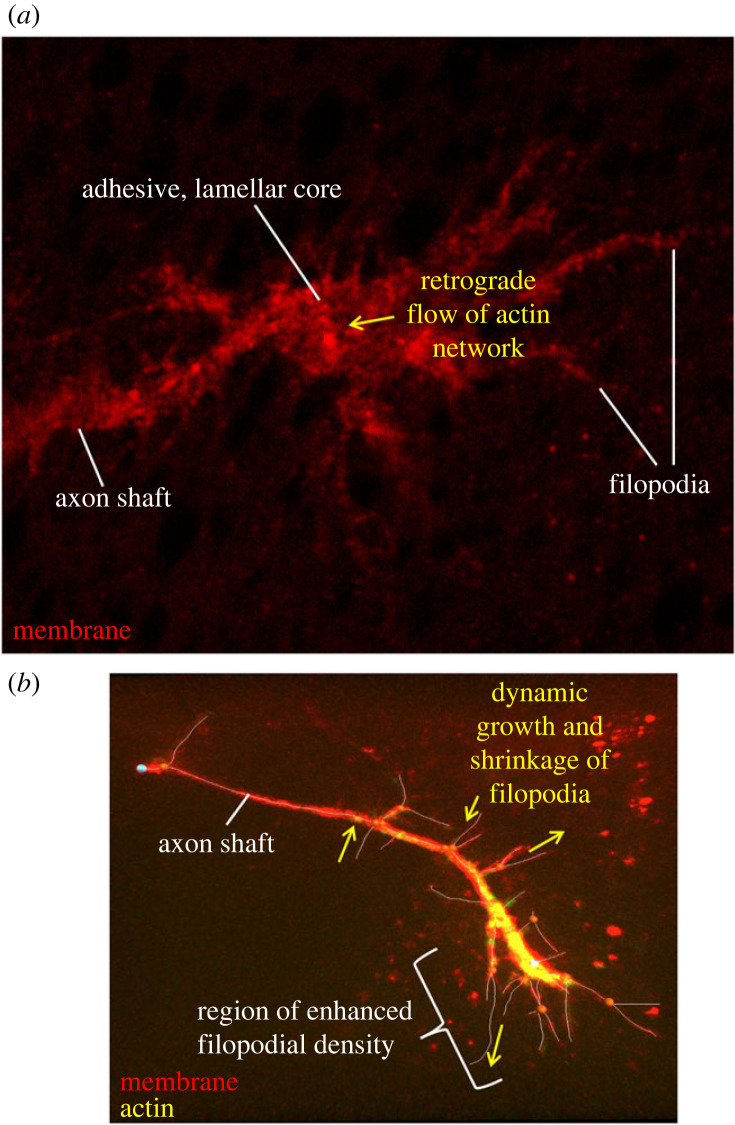
Figure 1.
Images of two styles of growth cones. (a) A typical adhesive, lamellar growth cone as often seen in vitro. The adherent core of the growth cone can be seen in the middle, with axon shaft projecting to the left and filopodia decorating the entire growth cone. Motility is thought to be driven by retrograde flow of actin in the palm of the growth cone, linked to the substratum by transient adhesive contacts to provide points of traction. Note that lamellipodial actin mesh was not visualized experimentally for this micrograph, but its presumed location and motion are represented by the yellow arrow. (b) A filopodial TSM1 growth cone. Membrane is labelled in red; actin in yellow. Filopodial projections have been traced (white lines). Note the concentration of actin near the distal end of the axon, associated with the region of highest filopodial density. Motility is associated with dynamic extension and retraction of filopodia (indicated with yellow arrows), with growth cone advance produced by preferential stabilization of filopodia whose orientation correlates with the direction of future axon growth. Note that this image presents a two-dimensional projection of this growth cone. In the animal, filopodia project in three dimensions, spreading as much above and below the plane of imaging as they do side-to-side.

