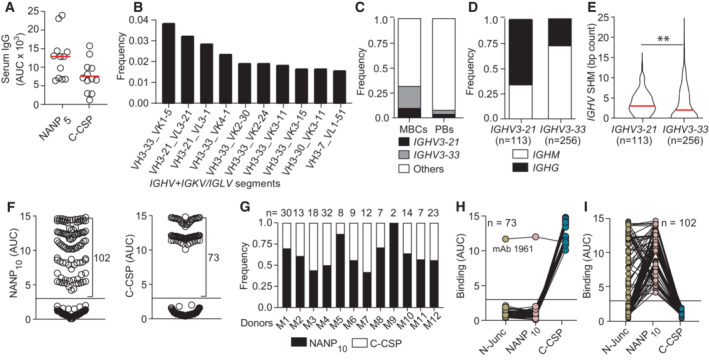
Figure 1. B cell response against the PfCSP C terminus.

-
AAnti‐NANP5 and anti‐C‐CSP serum IgG. Circles represent ELISA area under the curve (AUC) values for individual donors (n = 12).
-
BTen most frequent Ig heavy and light chain V gene pairs in PfCSP‐reactive memory B cells (MBCs; n = 1,172).
-
CUsage frequency of IGHV3‐21, IGHV3‐33 and other IGHV genes in PfCSP‐reactive MBCs (n = 1,172) and plasmablasts (PBs; n = 2,380).
-
D, EIsotype distribution (D) and somatic hypermutation (SHM) count (E) in IGHV3‐21 and IGHV3‐33 genes from MBCs in (B, C).
-
FNANP10 (left) and C‐CSP (right) binding of FL‐CSP‐reactive mAbs (n = 177). Circles represent ELISA AUC values for each mAb.
-
GFrequency of NANP10 and C‐CSP reactive mAbs per donor. The number of tested mAbs is indicated.
-
H, ICross‐reactivity of C‐CSP (H) and NANP10 (I) reactive mAbs with the PfCSP N‐junc, NANP10 and C‐CSP; n indicates the number of mAbs tested.
Data information: Red lines in (A and E) indicate mean values. Black horizontal lines in (F), (H) and (I) indicate the threshold for binding. (E). The statistical significance in E was assessed by two‐tailed Mann–Whitney test: **P = 0.0017. Data in (A) are representative of two independent technical replicates. Data in (F, H and I) are obtained from three independent technical replicates and indicated as mean.
Source data are available online for this figure.
