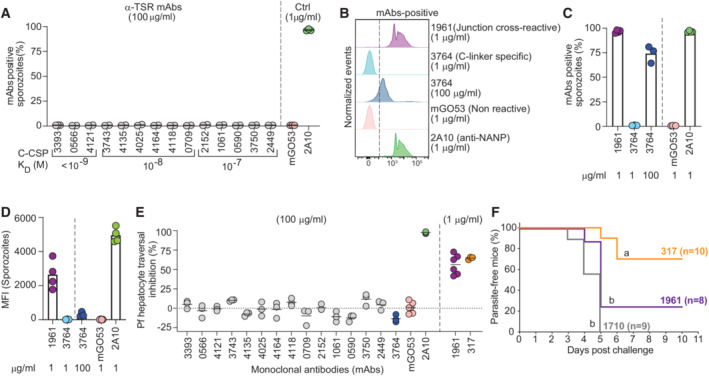
Figure 4. C‐CSP specific mAbs lack anti‐parasite activity.

-
APercent of live PbPfCSP(mCherry) sporozoites recognized by α‐TSR‐specific mAbs (100 μg/ml) as determined by flow cytometry, with the respective affinities measured by SPR. The positive control anti‐NANP mAb 2A10 (1 μg/ml; Triller et al, 2017) and negative control non‐PfCSP reactive mAb mGO53 (1 μg/ml; Wardemann et al, 2003) are shown for comparison (n = 2–3).
-
B–DRepresentative flow cytometry profiles (B), percentage of mAb‐positive live PbPfCSP(mCherry) sporozoites (C), and mean fluorescence intensity (MFI) (D) for the junction cross‐reactive mAb 1961, C‐linker‐specific mAb 3764 and the control mAbs 2A10 and mGO53 at the indicated concentrations (n = 3–4).
-
EPf sporozoite hepatocyte traversal inhibitory capacity of the indicated C‐CSP reactive, C‐CSP cross‐reactive (1961), and control (2A10, mGO53 and anti‐NANP 317; Oyen et al, 2017) mAbs at the indicated concentrations (n = 3–6).
-
FCapacity of the indicated passively‐transferred antibodies (100 μg) to protect mice from parasitemia after the bite of three PbPfCSP(mCherry)‐infected mosquitoes (n = 10 for mAb 317; Oyen et al, 2017, n = 8 for mAb 1961, and n = 9 for mAb 1710; Scally et al, 2018). Data show the percentage of parasite‐free mice in two independent experiments (only mice with detectable serum IgG concentrations of the indicated mAbs at the time of the challenge are shown; Fig EV4C). Groups marked with the same letter were not statistically significantly different (Mantel–Cox log‐rank test, see also Appendix Table S5).
Data information: Circles in (A, C–E) indicate independent biological replicates.
Source data are available online for this figure.
