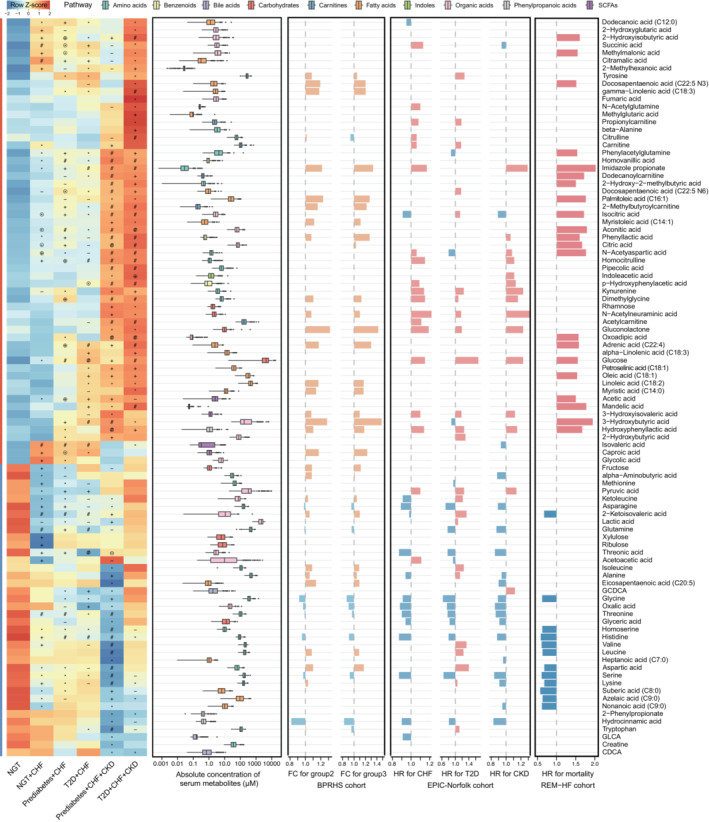
Figure 1. Microbially associated metabolites altered in CHF and its comorbidities.

First panel: the heatmap indicating the mean serum concentrations (scaled by row) of 96 metabolites in the REM‐HF cohort. P values were calculated by the Wilcoxon rank‐sum test. Symbols indicate the raw P values (− P < 0.1, *P < 0.05, + P < 0.01, # P < 0.001), and symbols with open circles indicate metabolite‐disease links that were potentially confounded by medications. Second panel: the boxplot showing the absolute serum concentrations of the corresponding metabolites with box colors for different pathway annotations. The central band in each box represents the median, the top, and bottom of the box the 25th and 75th percentiles, and the whiskers 1.5 times the interquartile range (n = 260; biological replicates). Third panel: the bar plot showing the fold‐changes (FC) of 39 metabolites associated with the cardiometabolic stress scores (group 1–3) in the BPRHS cohort. Forth panel: the bar plot showing the hazard ratio (HR) of each metabolite for the incidence of HF, T2D, or CKD identified in the EPIC‐Norfolk cohort. Last panel: the bar plot showing the hazard ratios (HRs) of 33 metabolites for CHF rehospitalization or cardiovascular death in the REM‐HF cohort. The HRs were calculated with Cox proportional hazards models, adjusting for age, sex, and BMI (likelihood‐ratio test P < 0.05 and Schoenfeld residuals test P > 0.05).Source data are available online for this figure.
