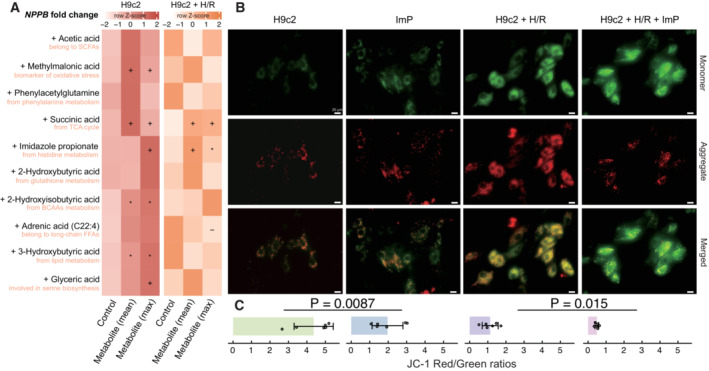
Figure 3. Cardiomyoblast‐metabolite coculturing and induction of NPPB gene expression.

-
AThe relative expression of NPPB (scaled by row) upon different metabolites exposure in H9c2 cells pretreated with or without hypoxia/reoxygenation (H/R; six replicates per group). Symbols indicate the raw P values (− P < 0.1, *P < 0.05, + P < 0.01) calculated by the Wilcoxon rank‐sum test.
-
BRepresentative JC‐1 staining images showing red fluorescence of JC‐1 aggregates and green signal of monomers. Scale bars: 20 μm.
-
CQuantification of mitochondrial membrane potential (n = 6, biological replicates). The data are shown as mean ± s.d.; Wilcoxon rank‐sum test (*P < 0.05, + P < 0.01).
Source data are available online for this figure.
