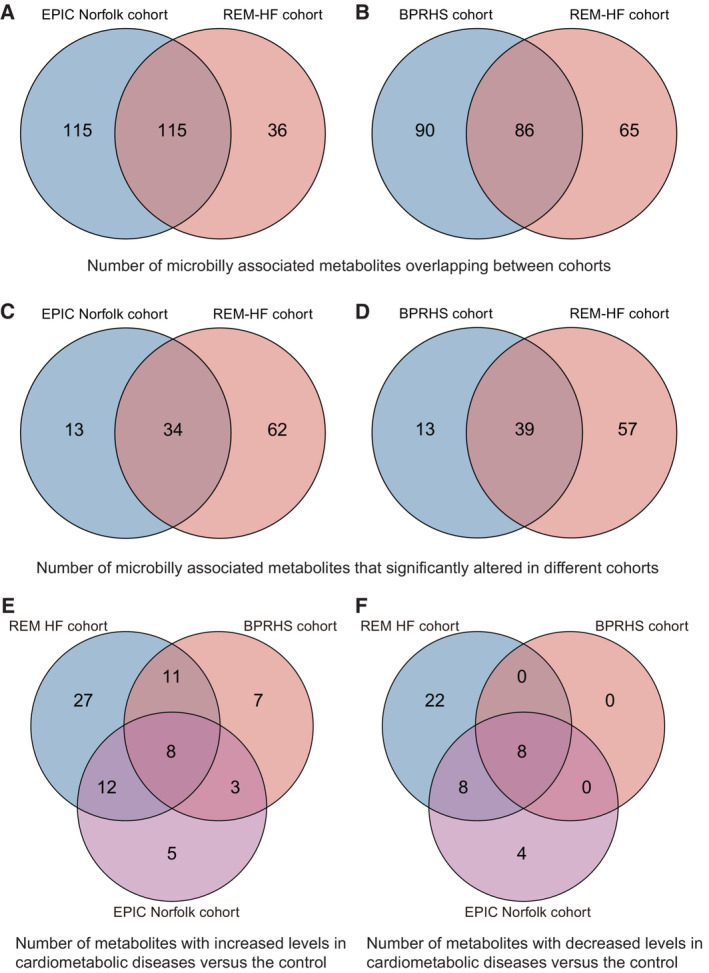
Figure EV3. Venn plots depicting numbers of shared metabolites across cohorts.

-
A–FNumbers of metabolites (A) and significantly changed metabolites (C) that were overlapping between REM‐HF and EPIC‐Norfolk cohorts and similarly for those (B, D) between REM‐HF and BPRHS cohorts. Numbers of increased (E) and decreased (F) metabolites across all three cohorts, respectively.
