
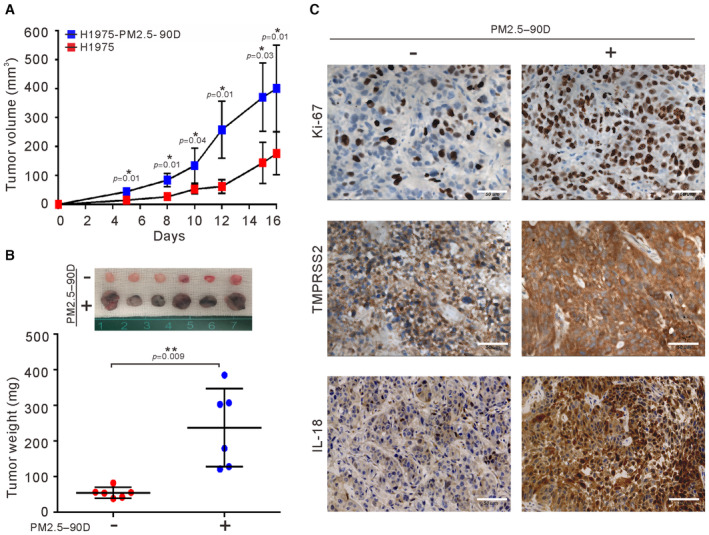
Figure 3. Effects of long‐term exposure to PM2.5 on tumor growth of lung cancer cells in vivo. H1975 cells were exposed to 50 μg/ml PM2.5 for 90 days. Both unexposed and exposed cells were injected subcutaneously into the flank of each mouse (n = 6 per group).
-
A, BThe tumor volume and excised tumor weight were measured. The sizes of tumors excised from each group are shown at the top of (B).
-
CIHC staining of excised tumors for Ki‐67, IL18, and TMPRSS2 is shown in (C). Scale bars, 50 μm.
Data information: The results shown in (A) and (B) are presented as the means ± SDs of six mice. *P < 0.05 and **P < 0.01, compared with untreated group. (A) P‐values were determined by two‐way repeated measures ANOVA with pairwise comparison of post hoc analysis with Benjamini–Hochberg (BH) correction. (B) P‐values were determined by two‐sample t‐test.
Source data are available online for this figure.