
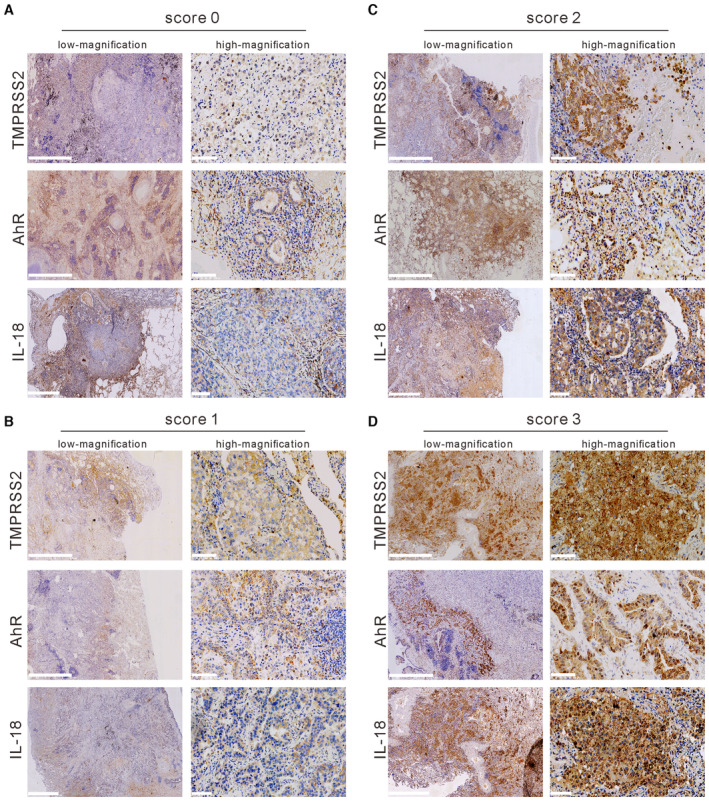
Figure EV5. Representative IHC staining images showing immunoreactivity.
-
A–D(A) Score 0, (B) score 1, (C) score 2, and (D) score 3 of TMPRSS2, IL18, and AhR in lung cancer tissue. Scale bars, 2.5 mm (low magnification) and 100 μm (high magnification).
Source data are available online for this figure.