
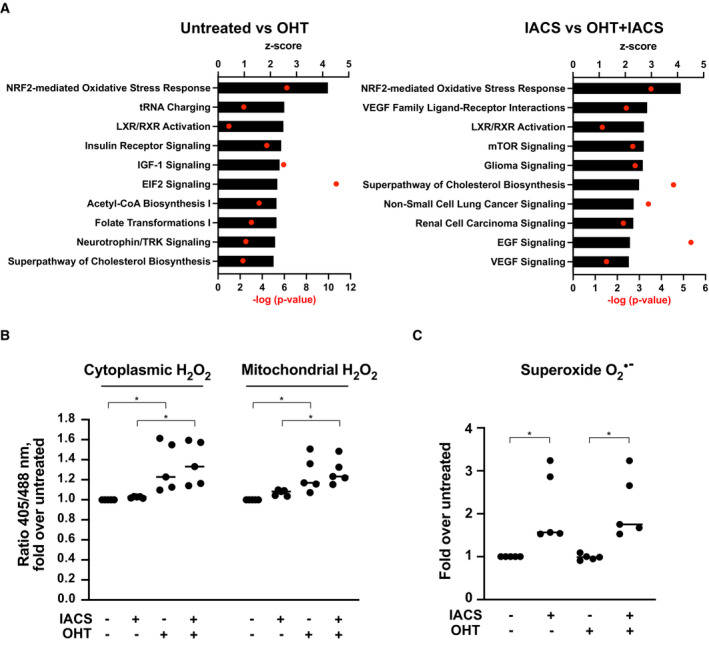
Figure 1. MycER activation causes ROS production and induces an oxidative stress response.
FLMycER cells, primed or not with OHT (48 h), were treated with 135 nm IACS‐010759 (IACS) for 24 (A) or 48 h (B–D).
- Top 10 OHT‐activated pathways (highest z‐score), as determined by IPA canonical pathway analysis on DEGs from cells treated or not with OHT (72 h), either alone (left) or in the presence of IACS‐010759 (for the last 24 h; right). Note that the RNA‐seq data and DEG lists used here are the same as in our previous study (Donati et al, 2022), while the IPA analysis presented here is new.
- H2O2 quantification, expressed as fold‐increase of the 405/488 nm fluorescence ratio in treated vs. untreated FLMycER cells, expressing either the cytoplasmic (left) or mitochondrial (right) roGFP2‐ORP1 biosensor.
- Superoxide anion O2 ·− production in treated vs. untreated FLMycER cells, based on dihydroethidium staining.
Data information: *P ≤ 0.05 (one‐way ANOVA). Each point in the graphs in (B and C) is from an independent biological replicate, each representing the average of thousands of events (single cells) in a distinct cell population, normalized to the untreated condition. Single‐cell measurement distributions from representative experiments are provided in Appendix Fig S1A and B, respectively.
Source data are available online for this figure.