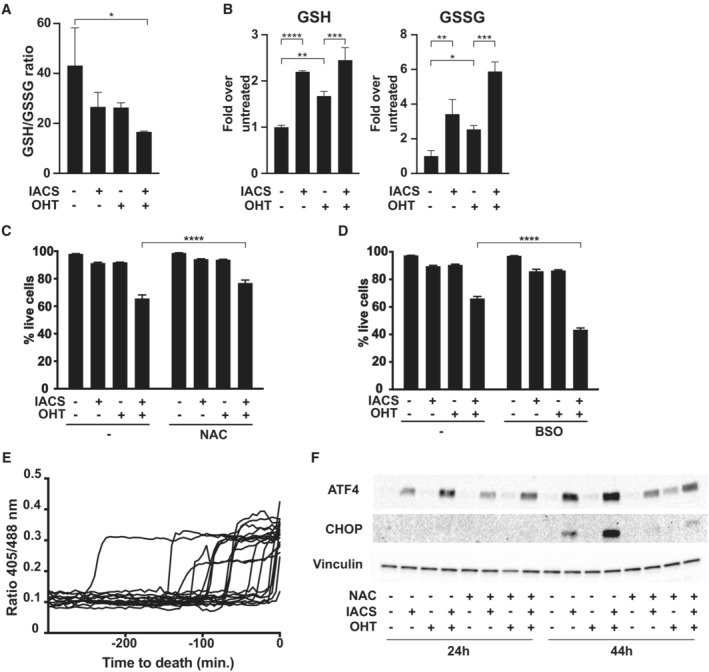
Figure 2. Disruption of redox homeostasis by IACS‐010759 induces cell death in MYC‐overexpressing cells.

-
A, BGlutathione redox state, given as (A) reduced to oxidized ratio and (B) glutathione quantification in FLMycER cells, measured after 40 h of IACS‐010759 treatment.
-
CCell viability, as determined by PI staining after 48 h of IACS‐010759 treatment, with or without the addition of 10 mM N‐acetyl‐cysteine (NAC).
-
DSame as (C), with 50 μM buthionine sulfoximine (BSO).
-
ETime‐lapse, single‐cell microscopic analysis of cytoplasmic glutathione redox potential before cell death, assessed as 405/488 nm fluorescence ratio from the Grx1‐roGFP2 biosensor in FLMycER cells treated with OHT and IACS‐1010759 (36 h at the onset of filming). The time of death (t = 0) was scored based on the cellular incorporation of PI, present in the culture medium.
-
FImmunoblot on lysates from FLMycER cells treated as indicated, with the addition of 10 mM NAC concomitantly with IACS‐010759.
Data information: In (A–D) n = 3 biological replicates; error bars: SD. *P ≤ 0.05; **P ≤ 0.01; ***P ≤ 0.001; ****P ≤ 0.0001 (one‐way ANOVA).
Source data are available online for this figure.
