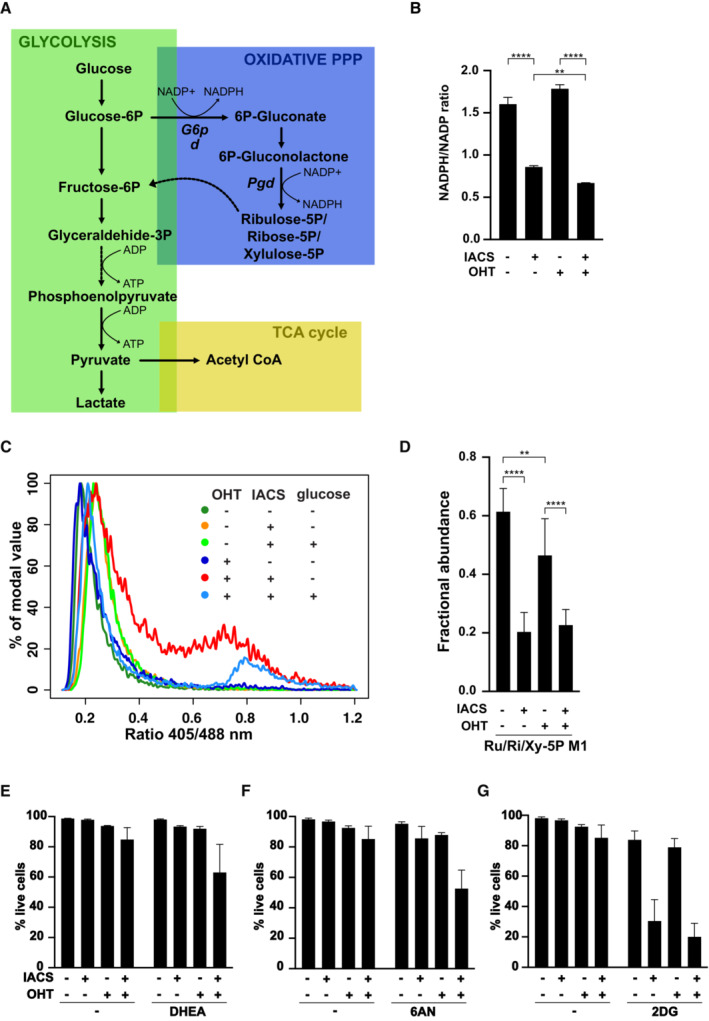
Figure 3. Pentose phosphate pathway protects MYC‐overexpressing cells from IACS‐010759‐induced toxicity.

-
ASchematic representation of glucose metabolism, highlighting NADPH‐ and ATP‐producing reactions.
-
B–GFLMycER cells were primed with 100 nM OHT and treated with 135 nM IACS‐010759, as indicated. (B) NADPH/NADP redox state in FLMycER cells, assayed after 40 h of IACS‐010759 treatment. n = 3 biological replicates. **P ≤ 0.01; ****P ≤ 0.0001 (one‐way ANOVA). (C) cytoplasmic glutathione redox potential, assessed after 44 h of IACS‐010759 treatment in FLMycER cells expressing the Grx1‐roGFP2 biosensor. Where indicated, 2.75 mM glucose was added to the medium and the measurement repeated after 3 h. (D) Fractional abundance of the 13C‐labeled glucose metabolites ribulose‐5P, ribose‐5P and xylulose‐5P (Ru/Ri/Xy‐5P), endpoints of the PPP oxidative phase, after 24 h of IACS‐010759 treatment. **P ≤ 0.01; ****P ≤ 0.0001 (two‐way ANOVA). (E–G) Cell viability after 40 h of IACS‐010759 treatment in the presence of (E) 50 μM dehydroepiandrosterone (DHEA), (F) 10 μM 6‐aminonicotinamide (6AN) or (G) 1 mM 2‐deoxyglucose (2DG). See Appendix Fig S3F for detailed statistical analysis.
Data information: In (D, E, G) n = 6; in (F) n = 9; all biological replicates; error bars: SD.
Source data are available online for this figure.
