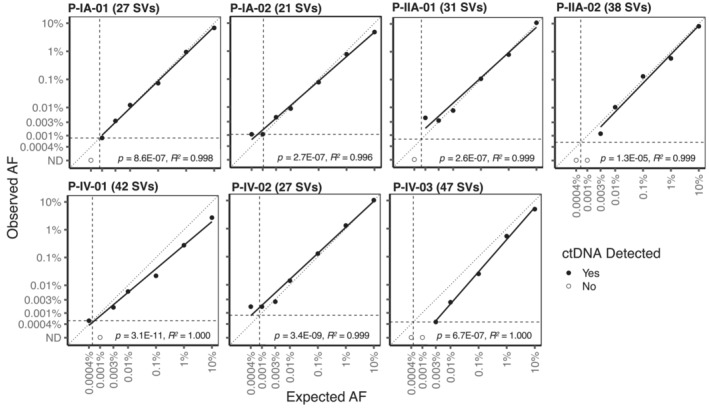
Figure 2. Relationship between observed and expected allele fractions (AFs) in tumor dilution series with SV‐multiplex PCR.

Numbers in brackets indicate the number of SVs (structural variants) targeted by SV‐multiplex PCR in each patient. Tumor dilutions ranged from 0.0004% to 10% AF. The vertical and horizontal dashed lines represent the theoretical limit of detection of each assay based on the number of analyzed SVs and input cell‐free DNA copies. The diagonal dotted line represents the unit line. The solid black line shows the linear regression fit. The P‐values of the slope parameter Wald t‐tests as well as the linear model‐fit R‐squared estimates are also indicated.
