
Figure EV2. SCNA plots and tumor fraction (TF) observed with the SCNA assays in plasma.
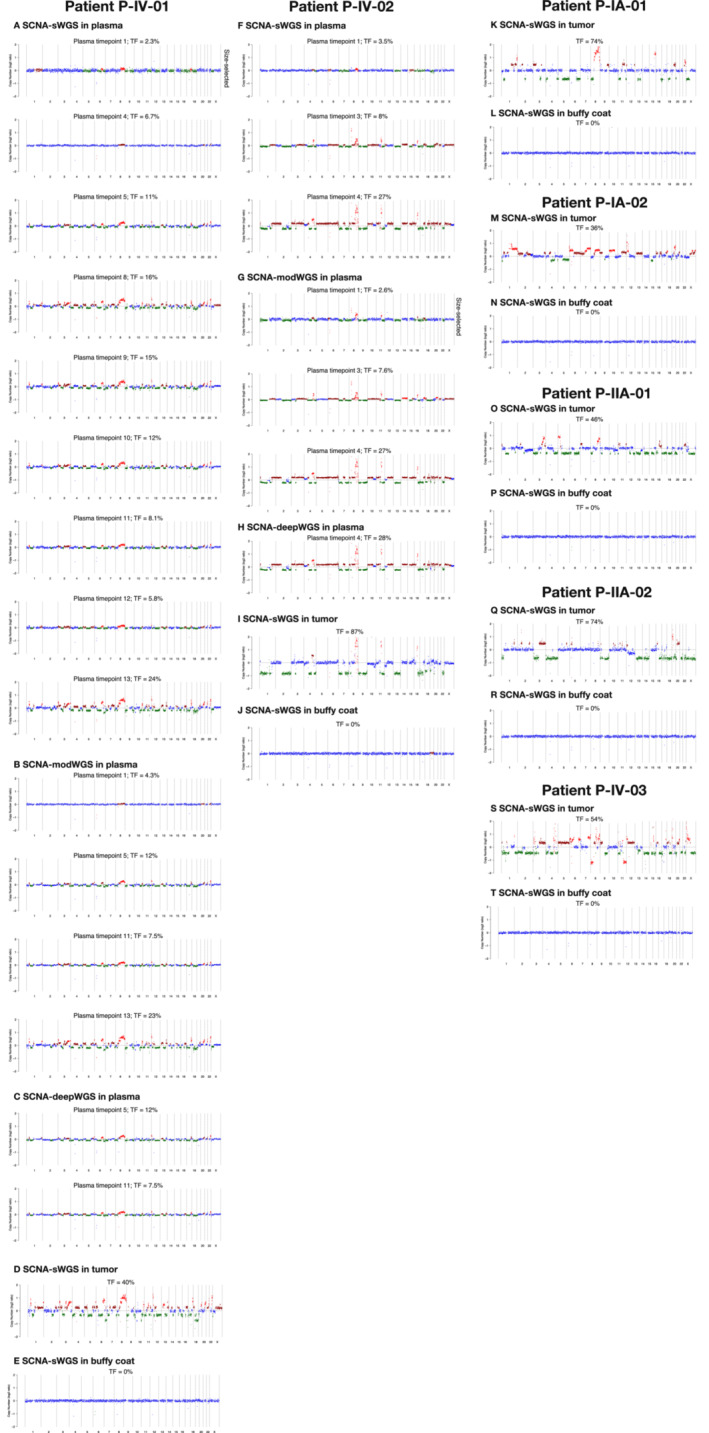
All plasma samples with ctDNA detected either before or after size selection with SCNA‐sWGS, modWGS, and deepWGS are plotted as well as tumor and buffy coat from the seven patients. Plots and tumor fraction (TF) plotted before size selection for all samples except those marked as “size‐selected”; in those samples, the plot corresponds to the SCNAs observed after size selection, while the tumor fraction is that generated before size selection. Tumor fraction estimated from ichorCNA. (A–E) SCNA plots from P‐IV‐01, (A) plasma samples detected with SCNA‐sWGS, (B) plasma samples detected with SCNA‐modWGS, (C) plasma samples detected with SCNA‐deepWGS, (D) sWGS of tumor tissue, and (E) sWGS of buffy coat. (F–J) SCNA plots from P‐IV‐02, (F) plasma samples detected with sWGS, (G) plasma samples detected with SCNA‐modWGS, (H) plasma samples detected with SCNA‐deepWGS, (I) sWGS of tumor tissue, and (J) sWGS of buffy coat. For both patients, all plasma samples detected have similar alterations between different plasma samples from the same patient tested with the different SCNA assays as well as with the tumor tissue. (K–T) sWGS of tumor and buffy coat from the remaining five patients with no plasma sample detected by the analysis of SCNAs.