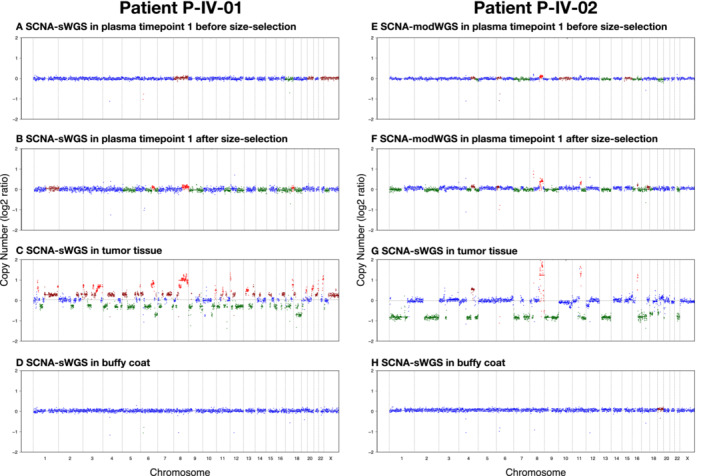
Figure 4. SCNA signal enrichment after in silico 90–150 bp size selection in patients P‐IV‐01 and P‐IV‐02.

(A–D) Patient P‐IV‐01: When analyzed with SCNA‐sWGS, (A) P‐IV‐01 plasma timepoint 1 shows a flat profile before in silico size selection and a tumor fraction of 2.3%, that is below the ichorCNA recommended cut‐off of 3%, while (B) after 90–150 bp size selection, copy‐number changes can be observed. These copy numbers match those observed (C) in tumor and are not present in (D) matched buffy coat.
(E–H) P‐IV‐02: (E) When analyzed with SCNA‐modWGS, P‐IV‐02 plasma timepoint 1 has a tumor fraction below the ichorCNA recommended cut‐off of 3% (tumor fraction of 2.6%) and is, therefore, classified as undetected even though small copy‐number changes can be observed. (F) Following in silico size selection, those changes become more apparent. The copy‐number aberrations match those observed (G) in tumor and are not present in (H) matched buffy coat.
