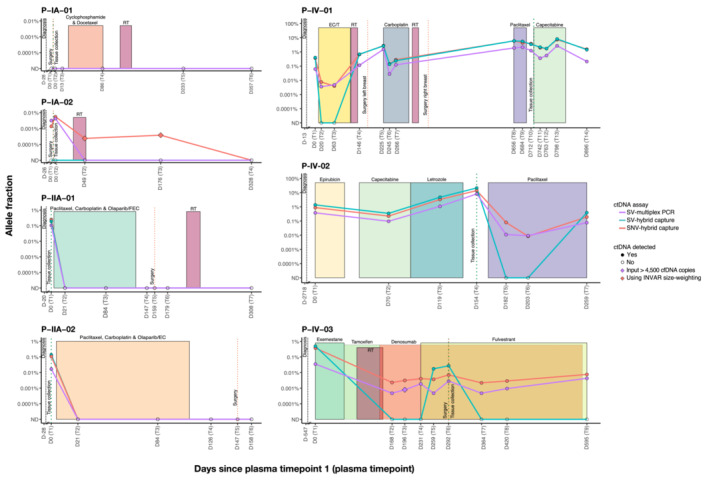
Figure EV4. Clinical information and detection of ctDNA in each patient using targeted ctDNA assays.

The shaded boxes represent different treatment periods and the vertical dotted lines mark the time of diagnosis (black), the time of surgery where appropriate (dark orange), and the time of tissue collection for whole‐genome sequencing (dark green). Days indicated on the x axis refer to the number of days before or after the collection of the first plasma sample. Two samples were taken at day 0 (D0) in stage IA patients (P‐IA‐01 and P‐IA‐02), before (T1) and after surgery (T2). Individual plots showing the allele fraction from every ctDNA assay can be found in Fig 3. RT: radiotherapy; FEC: 5 fluorouracil (5FU), epirubicin, and cyclophosphamide; EC: epirubicin and cyclophosphamide; /T followed by docetaxel; ND: Not detected.
