. 2023 Apr 26;5(3):e220082. doi: 10.1148/ryai.220082

Figure 6:

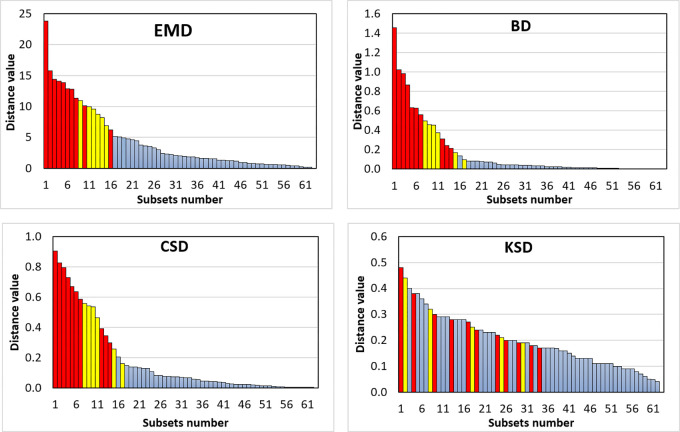
Waterfall plots of distance metrics related to the performances of the federated models in 62 grouped subsets evaluations. Bar color indicates the P values calculated using paired t test: red = P < .05, yellow = .05 ≤ P < 0.10, blue = P ≥ 0.10. BD = Bhattacharyya distance, CSD = χ2 distance, EMD = earth mover’s distance, KSD = d statistic of Kolmogorov-Smirnov test.

Waterfall plots of distance metrics related to the performances of the federated models in 62 grouped subsets evaluations. Bar color indicates the P values calculated using paired t test: red = P < .05, yellow = .05 ≤ P < 0.10, blue = P ≥ 0.10. BD = Bhattacharyya distance, CSD = χ2 distance, EMD = earth mover’s distance, KSD = d statistic of Kolmogorov-Smirnov test.