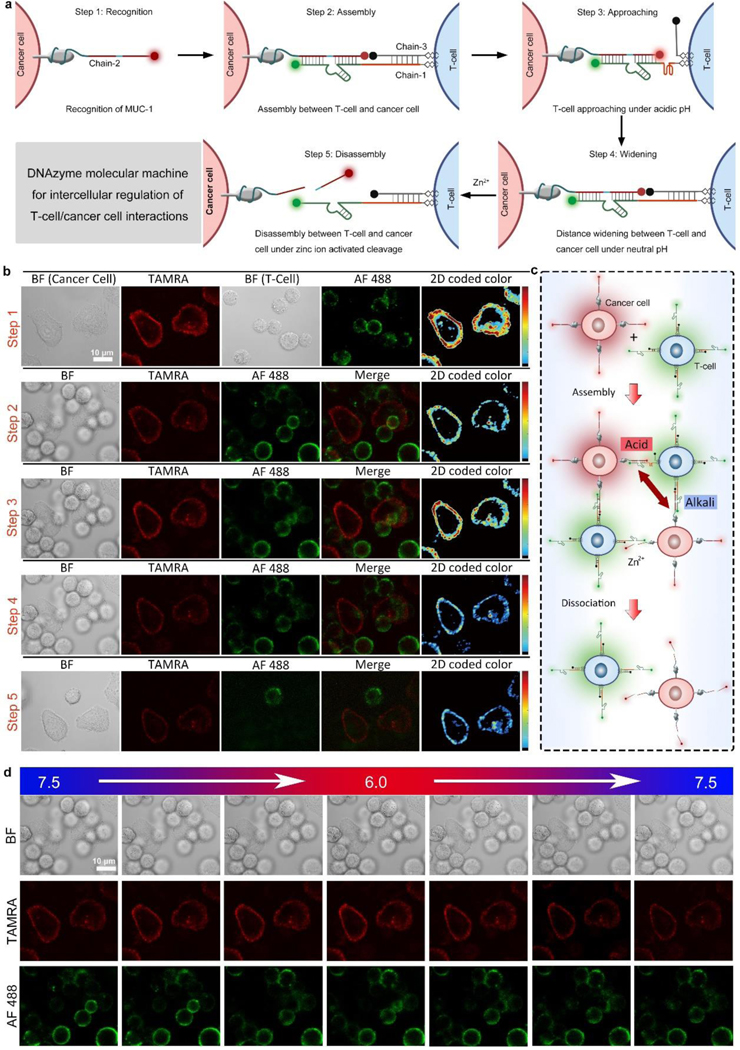
Figure 1.
Dynamic intercellular regulation. (a) Intercellular regulation of T-cell/cancer cell interactions by DNAzyme molecular machines constructed by chain-1, chain-2, and chain-3. Step 1–5: recognition, assembly, approaching, widening, and disassembly. (b) Cell images showing the dynamic regulation of cell-cell interactions between T-cells and cancer cells corresponding to Step 1–5 in (a). Color bar: 0 to 250 from bottom to top. (c) Distance control between T-cells and cancer cells by pH regulation. (d) Cell images showing the cell-cell distance changes under different pH values. BF: bight-field, TAMRA: red fluorescence, AF 488: green fluorescence, Merge: mixed green and red channel. 2D coded color: pseudo-color of red channel intensity.

