
Figure 2: Predictive performance of DLA and radiologists for ENE prediction in E3311.
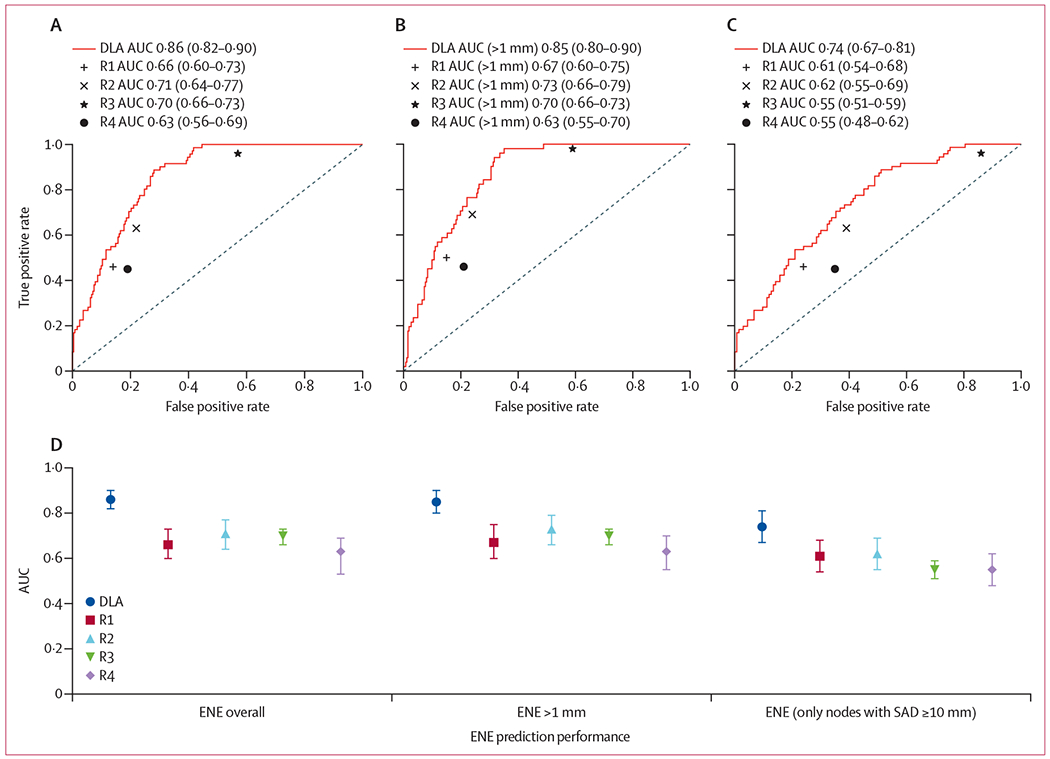
(A) Overall, (B) for ENE larger than 1 mm in extent (n=178 patients, 313 lymph nodes), and (C) in nodes with a short-axis diameter of 10 mm or more (n=204 lymph nodes). ROC curves are displayed with corresponding area under the curve (AUC). Comparative AUC with confidence intervals are shown (D) with the addition of performance in the subgroup of nodes with SAD ≥10 mm. p<0·001 for each comparison between DLA and R1–4. AUC=area under curve. DLA=deep learning algorithm. ENE=extranodal extension. R1–4=radiologists 1–4. ROC=receiver operating characteristic. SAD=short-axis diameter.