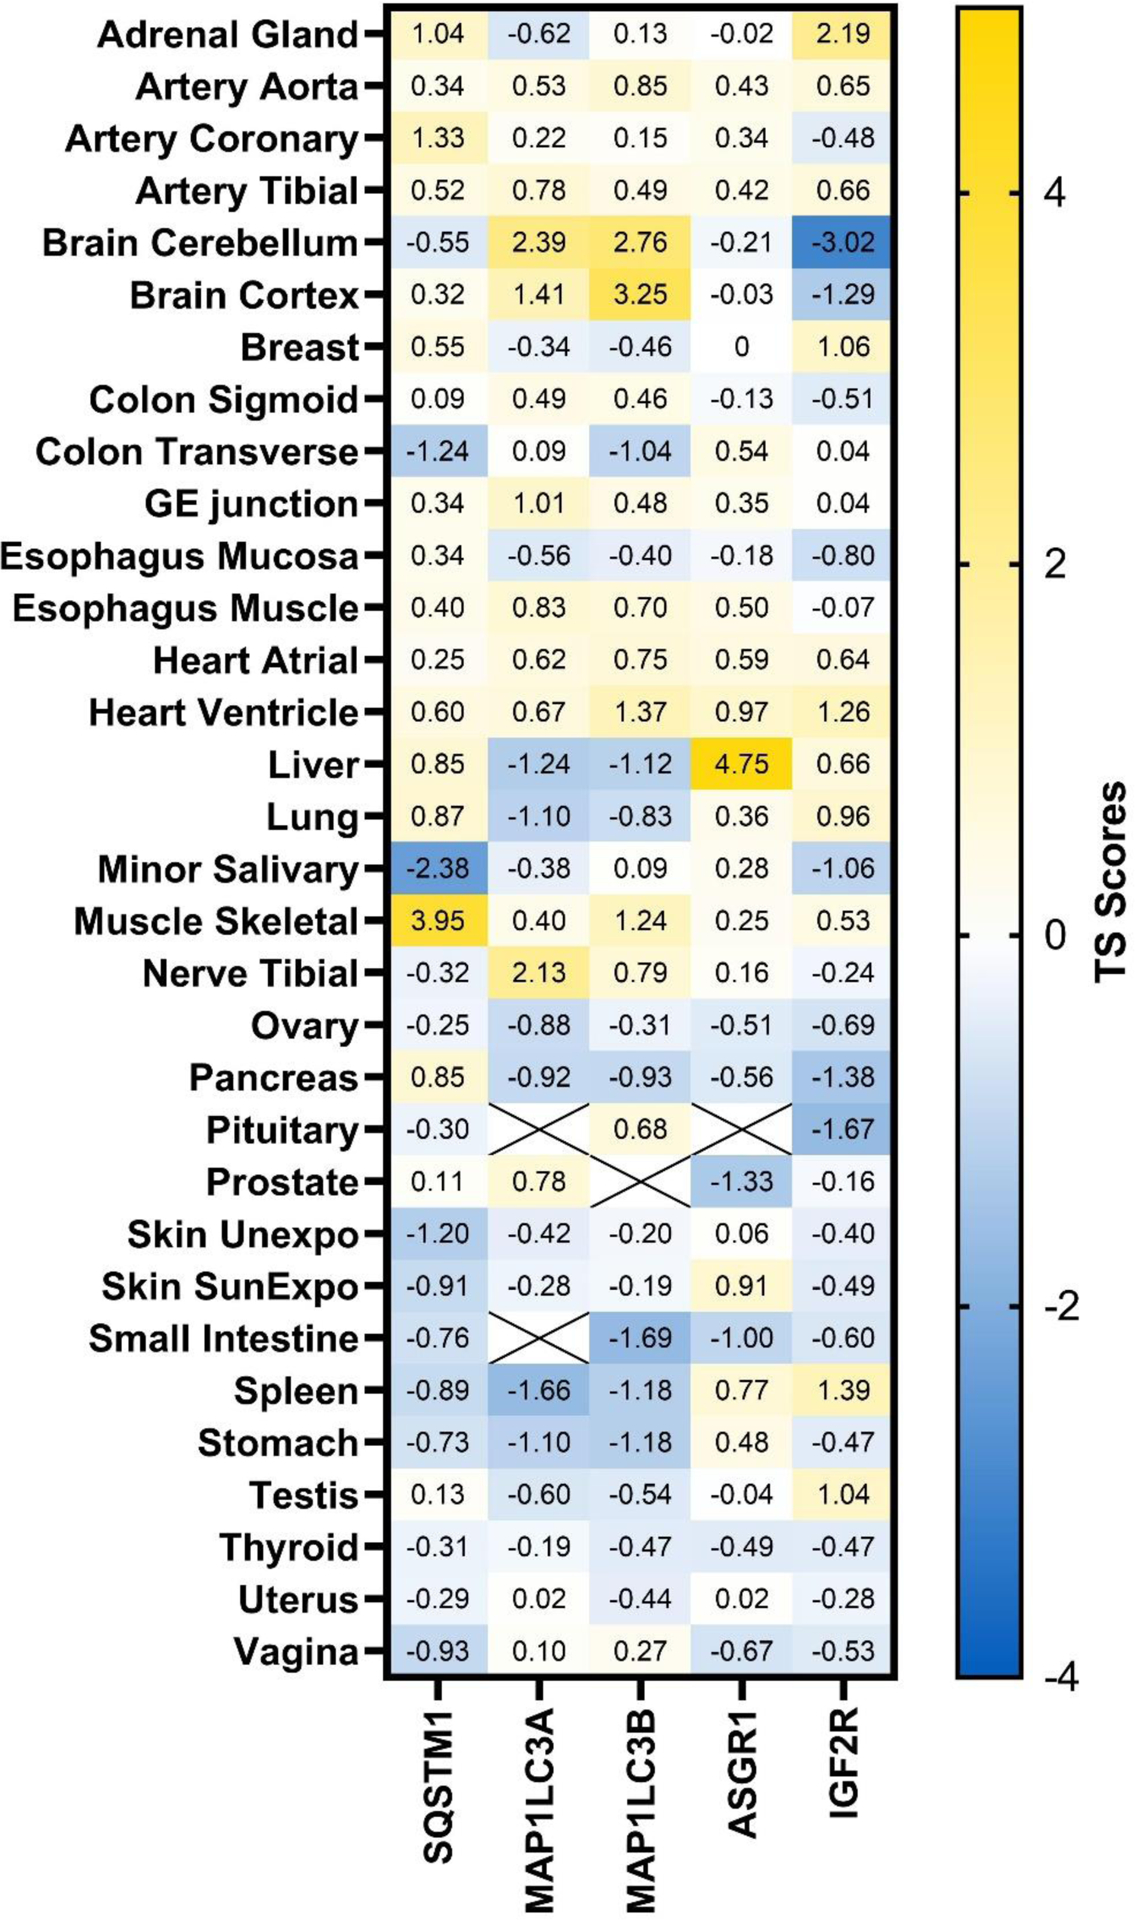
Figure 6:

Tissue distribution of lysosome pathway related proteins. Protein abundance was measured using quantitative proteomics.128 Tissue selectivity (TS) scores were calculated and plotted. TS score >2.5 is considered highly enriched in certain tissues. SQSTM1: sequestosome 1 or p62; MAP1LC3A: microtubule associated protein 1 light chain 3 α; MAP1LC3B: microtubule associated protein 1 light chain 3 β; ASGR1: asialoglycoprotein receptor 1; ASGR2: asialoglycoprotein receptor 2; IGF2R: insulin like growth factor 2 receptor or CI-M6PR. The TS score for ASGR2 is unavailable.
