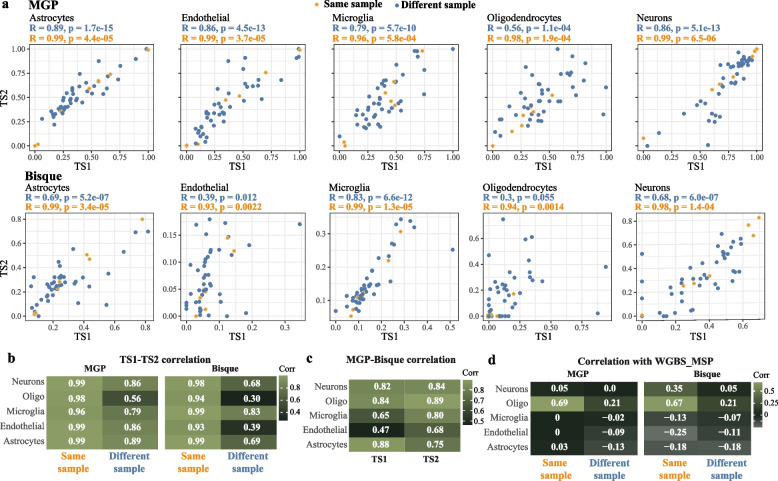
Fig. 2.
Estimate correlation. a Correlation between RNAseq1 (TS1) and RNAseq2 (TS2)-based estimates, using MGP (top) or Bisque (bottom). Each point represents one individual. For 42 of the individuals, mRNA was extracted for different but nearby tissue samples (blue), while for seven of the individuals the RNA was extracted from the same tissue sample but sequenced twice as part of RNAseq1 and RNAseq2 datasets (yellow). Pearson’s correlation for each cell type is shown separately for estimates derived from the same and different tissue samples. b Summary table of the correlation values shown in a. c Correlation between the estimates derives using the two RNA-based estimation methods in RNAseq1 (TS1) and RNAsq2 (TS2) datasets. d Correlation between RNA-based (MGP or Bisque) and WGBS-based estimates derived from the same (RNAseq1, WGBS) or different tissue samples (RNAseq2, WGBS). RNAseq2 estimates derived from the seven resequenced samples were excluded from the analysis

