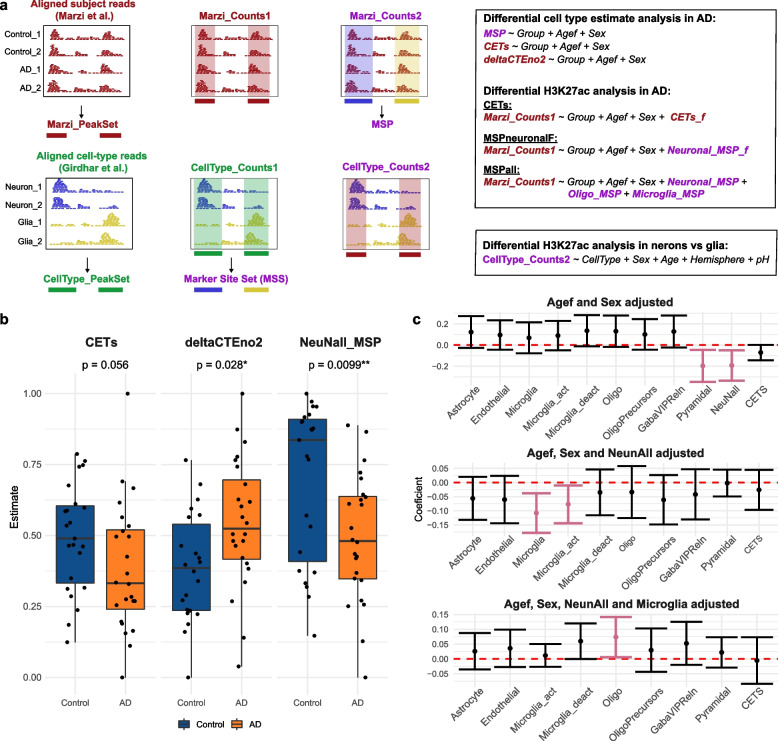
Fig. 4.
Experimental design of the re-analysis of Marzi et al. data. a Schematic representation of the two different ChIP-seq datasets (Marzi et al. and Girdhar et al.) used for the re-analysis and their respective peak sets (left), the original count matrices (middle) and the count matrices obtained by quantifying the reads from one data in the peak set from the other data (right). Data obtained from Marzi et al. are indicated in dark red. The different types of analyses and the different models used throughout the re-analysis are shown in the two frames. b Group differences in the neuronal estimates. The indicated p-values are based on the statistical models of differential cell type analyses described in a. c Estimated group effects (AD vs. control) and 95% confidence intervals of the indicated cell types. Shown are the estimates based on model adjusting for demographic covariates only (top), demographic covariates + neuronal MSP (middle) and demographic covariates + neuronal MSPs + microglia MSPs (bottom). Microglia_act: genes upregulated in activated microglia; Microglia_deact: genes downregulated in activated microglia; OligoPrecursors: oligodendrocyte precursor cells; GabaViPReln: VIP and Reelin-positive cells; NeuNall: All peaks with log2 fold change > 3 and adjusted p-value < 0.05 between neuronal (NeuN+) and glial (NeuN−) cells

