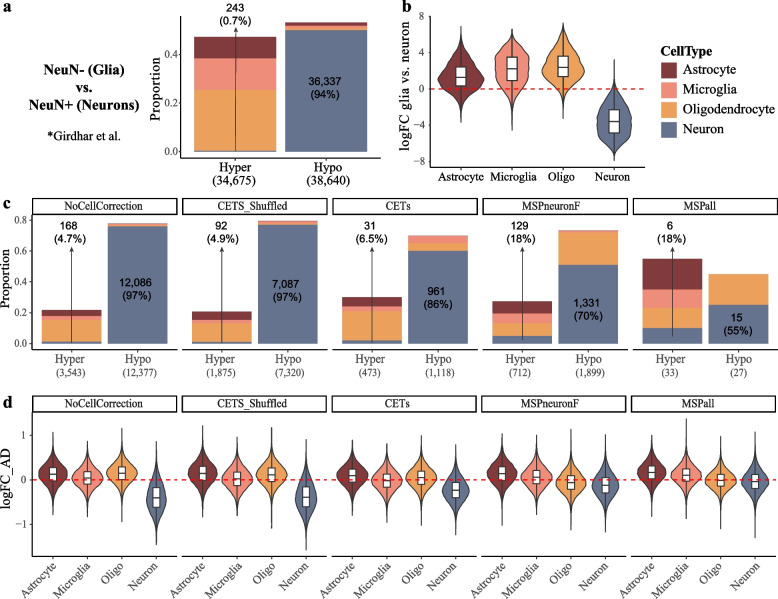
Fig. 6.
Assessment of the estimate performance using cell type-specific promoter/enhancer regions. Association between cell type-specific promoter/enhancer regions defined in Nott et al. [30], with the regions exhibiting differential acetylation between glia and neurons (a,b) or the outcome of differential acetylation analyses in AD using different cell composition estimation approaches (c,d). a,b Analysis of pooled glia (NeuN−) and neuron (NeuN+) H3K27ac ChIP-seq data from Girdhar et al. [25]. c,d Analysis of H3K27ac ChIP-seq data from bulk tissue entorhinal cortex of individuals with AD and controls from Marzi et. al [14]. a,c Stacked bar plots showing the proportion of differentially acetylated regions (FDR < 0.05) overlapping with promoter/enhancer regions unique to each of the cell types. Proportion (y-axis) was calculated relative to all significant regions overlapping with a cell type-specific promoter/enhancer region. The total number of hypo- and hyperacetylated regions meeting this criterion is indicated on the x-axis, in parenthesis. The number of peaks overlapping with neuron-specific promoter/enhancer regions is indicated on the bar plot area. Percentage was calculated separately for hypo- and hyperacetylated regions. b,d Violin plots showing the estimated acetylation fold of change in all peaks overlapping with a cell type-specific promoter/enhancer region, regardless of their significance level

