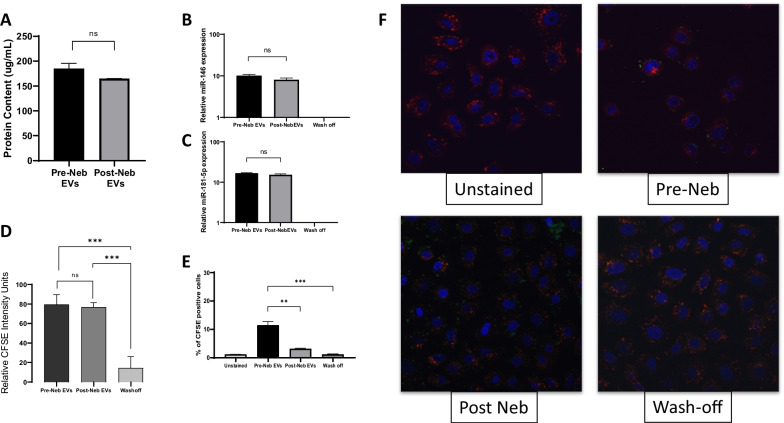
Fig. 2.
EV payload and integration with target cells pre- and post-nebulisation. UC-EV were passed through a nebuliser and total protein (A), mIR-146 (B) and miR-181-5p (C) quantified by QPCR. The mean intensity of a CSFE-label delivered by EVs to target lung epithelial cells was quantified by flow cytometry (D). The percentage of cells in a lung epithelial monolayer that was positive for CFSE label was also assessed with EVs pre- and post-nebulisation (E) and representative images selected (F). Pre Neb-EVs N = 3, Post Neb-EVs N = 3, Wash-off N = 3. **p < 0.01. ***p < 0.001. ns = no significant difference

