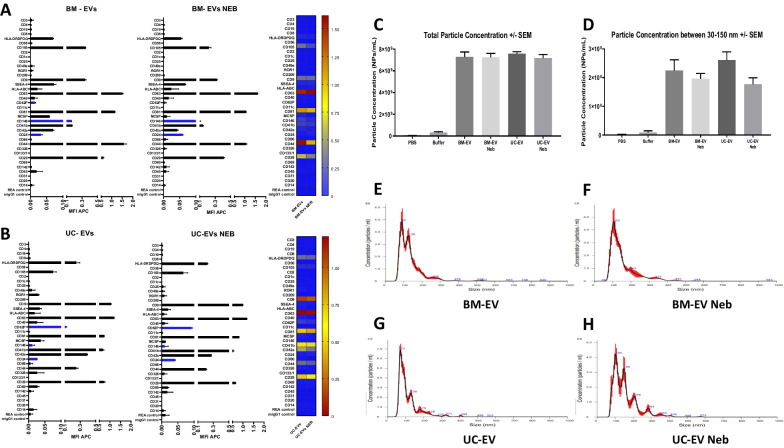
Fig. 3.
Nanotracker and surface marker analysis of EVs pre- and post-nebulisation. BM-EV (A) and UC-EV (B) samples were analysed by MACSPlex Exosome Kit surface marker antibody panel and flow cytometry, with pre- (left side) and post- (right side) nebulisation samples compared by heat map. In nanotracker analysis, total number of particles was established for each EV type pre- and post-nebulisation (C) and in the exosome size range (D). Particle size distributions were also constructed for BM-EV pre- (E) and post- (F) nebulisation and for UC-EV pre- (G) and post- (H) nebulisation. N = 6

