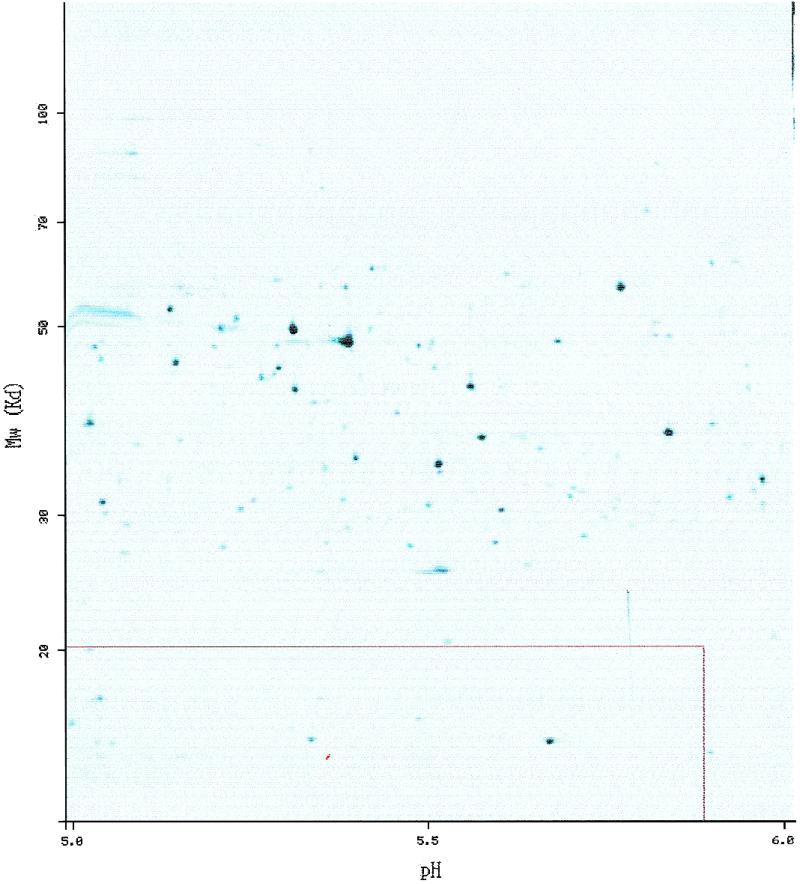
Figure 2.

The protein from Figure 1 shown on the SWISS-2DPAGE E.coli reference map for pI range from 5 to 6 (ECOLI5–6). The protein spot itself is highlighted in red, and the red rectangle around shows the theoretical region where one would expect to see the protein, computed from the SWISS-PROT protein sequence.
