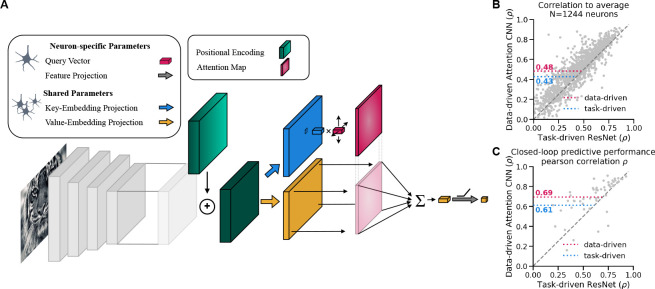
Figure 2:
a) Schematic of the Attention Readout. b) Correlation to average scores for 1244 neurons. The data-driven with attention readout (pink) model shows a significant (as per the Wilcoxon signed rank test, p-valu = 6.79 · 10−82) increase in the mean correlation to average in comparison to the task-driven ResNet (blue) model. c) Predictive performance comparison of the two models in a closed-loop MEI evaluation setting. Showing that the data-driven with attention readout model better predicts the in-vivo responses of the MEIs.

