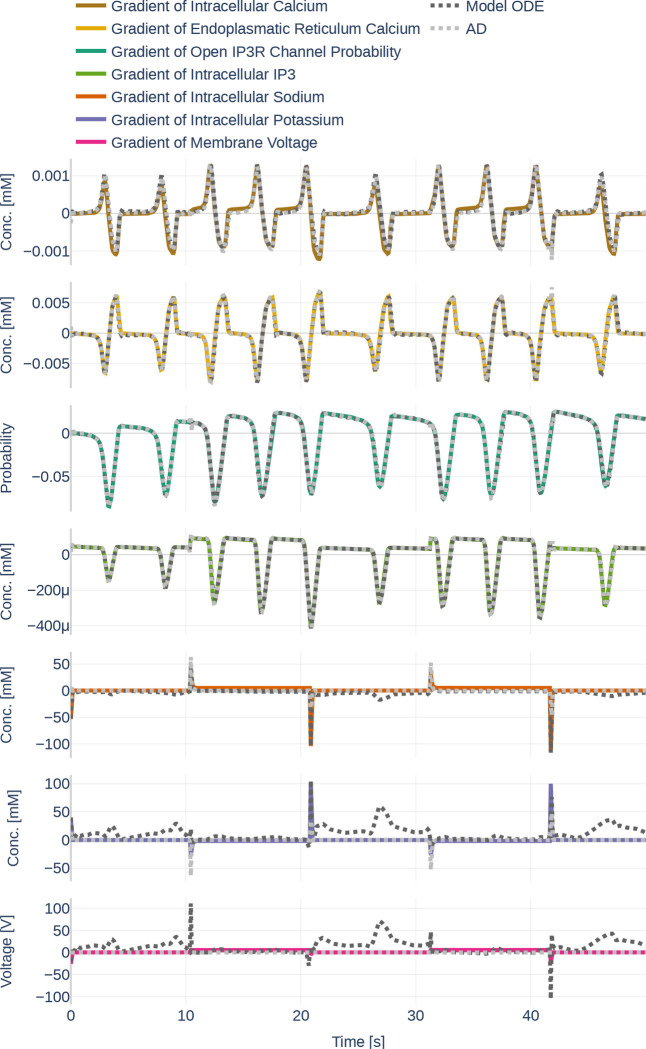
Figure 15.
Gradients as they are learned by the neural network (light gray, dotted lines). Furthermore, it shows the gradients outputted by the Oschmann et al. model if it is fed the neural network output as input (dark gray, dotted lines) and the gradients as they originally occur (colored lines). The used glutamate stimulation is shown in Figure 9.

