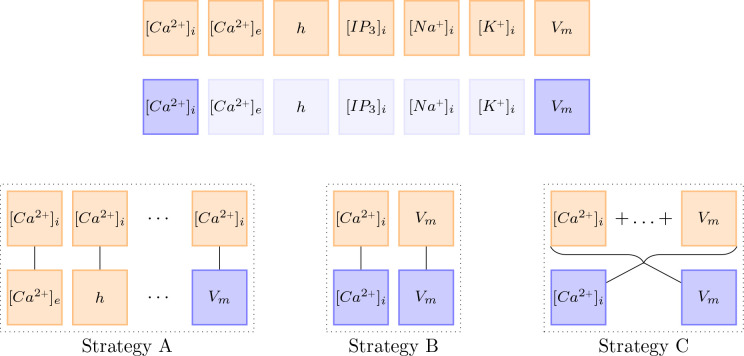
Figure 19.
This figure visualizes the three different update strategies. Orange boxes stand for the gradient with respect to the network parameters of the ODE loss . Blue boxes stand for the gradient with respect to the network parameters of the data loss . Almost transparent blue boxes indicate that the respective data was not observed and is therefore not considered in the loss functions.

