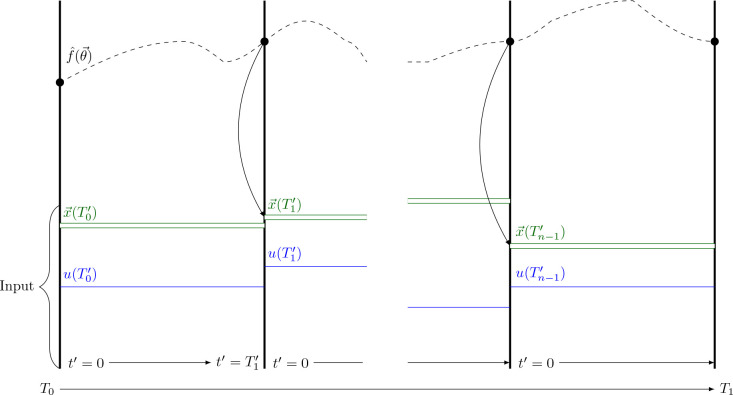
Figure 21.
Schematic of data propagation in a PINC based on a figure in the original paper by Antonelo et al. [2021]. is the control input of the different intervals. represents the corresponding initial conditions. is the function learned by the neural network.

