Figure 3.

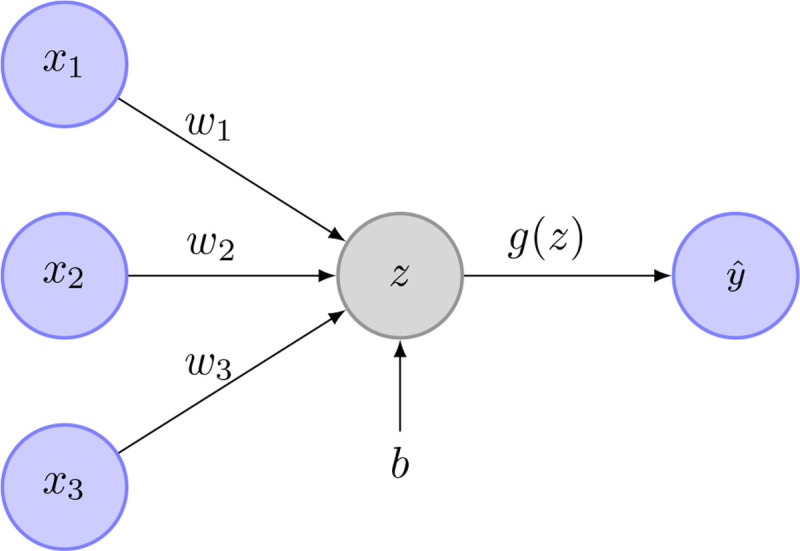
Example image of a perceptron. In this case, are the inputs. The weights are and is the perceptron bias. is the weighted sum of the network inputs and the bias. is the activation function. is the perceptrons output.

Example image of a perceptron. In this case, are the inputs. The weights are and is the perceptron bias. is the weighted sum of the network inputs and the bias. is the activation function. is the perceptrons output.