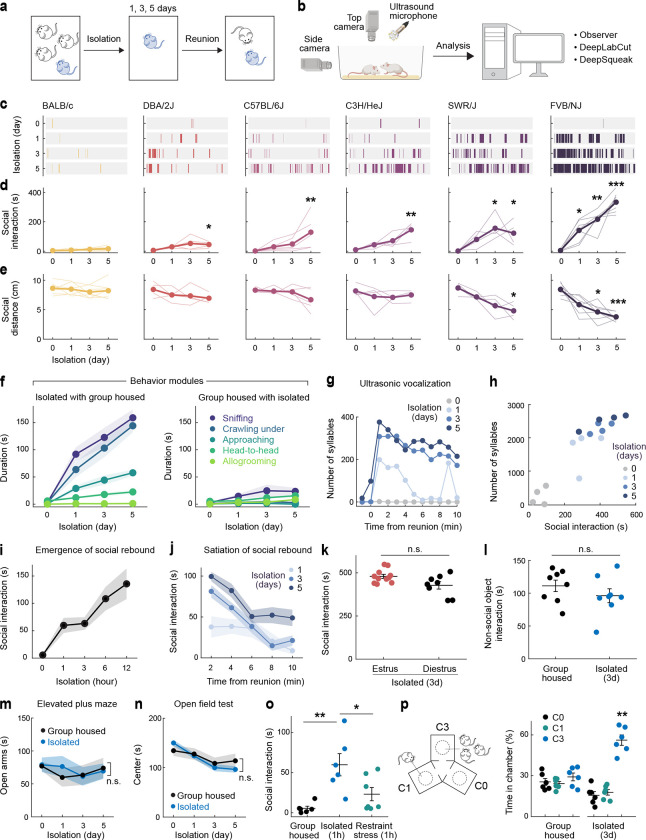
Figure 1. Social rebound as behavior manifestation of social homeostasis.
a, b Short-term social isolation/reunion behavioral paradigm and analysis pipeline. c, Raster plots of social events during reunion on example mouse from each strain. d, e Total duration of social interaction and average distance between two mice (social distance) during 10 min social reunion. Thin lines represent individual mice, thick lines are cohort average (BALB/c n=7, DBA/2J n=4, C57BL/6J n=5, C3H/HeJ n=4, SWR/J n=4, FVB/NJ n=7). f, Behavioral modules displayed during social rebound by previously isolated (left) versus paired group housed FVB mice (right), n=7 pairs. g, Ultrasonic vocalization (USV) during social reunion from example FVB mouse. h, Correlation between duration of social interaction and number of USV syllables during social reunion. Each dot represents a mouse, n=4. i, Emergence of social rebound in FVB mice following increasing time in isolation, n=6. j, Satiation of social rebound after various lengths of isolation, n=7. k, Social rebound in different phases of the estrous cycle, estrus phase n=11, diestrus phase n=8. l, Investigation of non-social object in group housed versus isolated FVB mice, n=8. m, n, Elevated plus maze test (n=5) and open field test (n=9) in isolated vs group housed FVB mice. o, Social interaction in FVB mice after 1h of social isolation, n=6 or body restraint stress, n=7. p, Preference test among empty (C0), one-mouse (C1) and 3-mice chambers (C3), n=6. d, e, Friedman test between baseline (day 0) and each isolation day; k, l, o, Mann–Whitney U test; m, n, Two-way ANOVA; p, Friedman test; n.s., not significant; *p<0.05, **p<0.01, ***p<0.001. All shaded areas and error bars represent the mean ± s.e.m.

