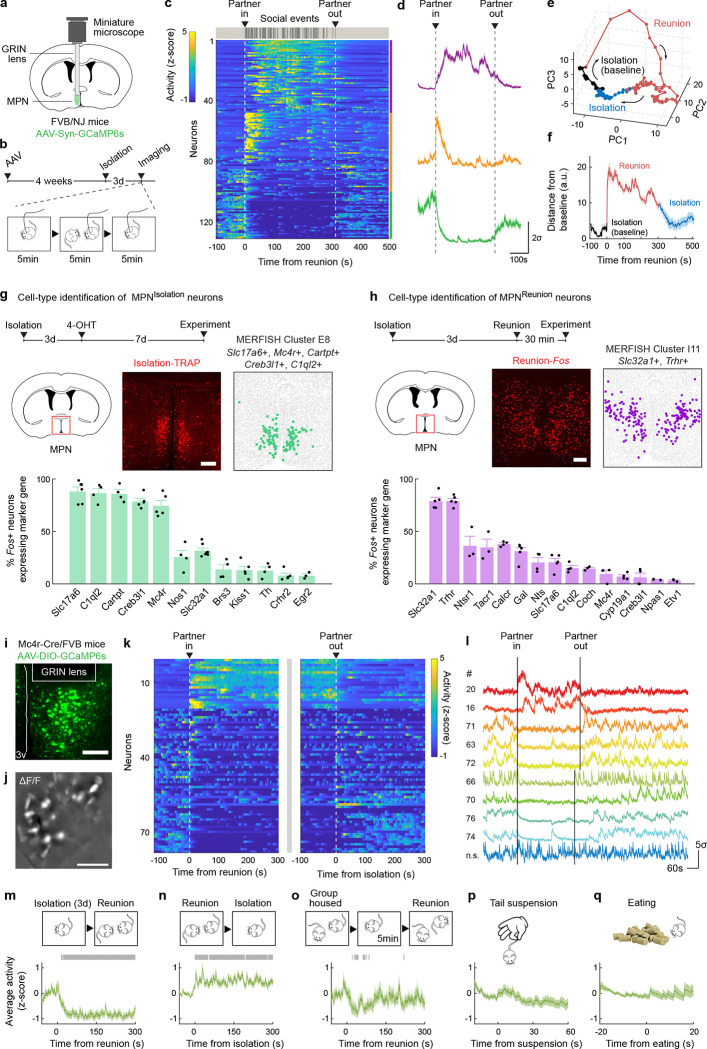
Figure 2. Identification of neuron types underlying social homeostasis.
a, Microendoscopy calcium imaging in the hypothalamic medial preoptic nucleus (MPN). b, Behavioral and calcium imaging paradigm. c, MPN pan-neuronal activity during social isolation and reunion. Heatmap of activity in example mouse, n=3 mice. d, Average activity of neuronal populations from c with distinct activity patterns during isolation and reunion. e, Principal component analysis of population activity in c. Bin size = 5s. f, Distance from each PCA time point to the mean of baseline. Bin size = 1s. g,h, Cell type identification of MPNIsolation (g) and MPNReunion (h) neurons based on overlap between activity induced Fos and expression of neuron-type marker genes, n=3–6 for each marker gene. i, Representative image showing MPNMc4r+ neurons expressing GCaMP6s. j, Example imaging field of GRIN lens, represented as ΔF/F. k, MPNMc4r+ neuronal activity during social isolation and social reunion. n=78 significantly modulated neurons pooled from 3 mice. l, Calcium activity of 10 example MPNMc4r+ neurons. m-q, Average calcium activity of reunion-inhibited MPNMc4r+ neurons in distinct behavioral regimes. Gray bars indicate significance of activity above or below 95% confidence interval of baseline. All shaded areas and error bars represent the mean ± s.e.m. unless otherwise noted. All scale bars, 200μm.

