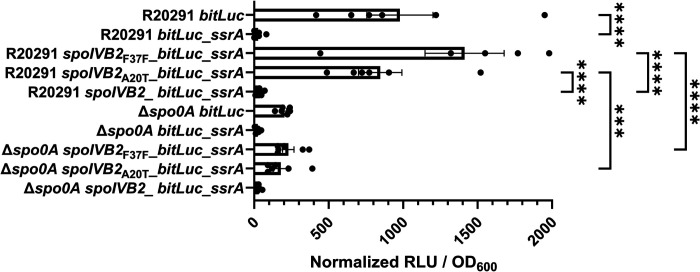
Figure 8. Luciferase assays show minimal differences between spoIVB2 protein levels.
Steady-state protein levels of the indicated strain were determined using alleles with an engineered ssrA tag (as described in the materials and methods). The cultures were grown for 48 hours and the OD600 and the RLUs were determined. The RLUs were normalized to the OD600 of each culture. All data represents the average of six independent experiments. One data point in the R20291 spoIVB2F37F_bitLuc_ssrA data set was found to be an outlier by the ROUT test and was removed from analysis. Statistical analysis by ANOVA with Šίdák’s multiple comparison test. * P<0.05, ** P<0.01, *** P<0.001, **** P<0.0001.

