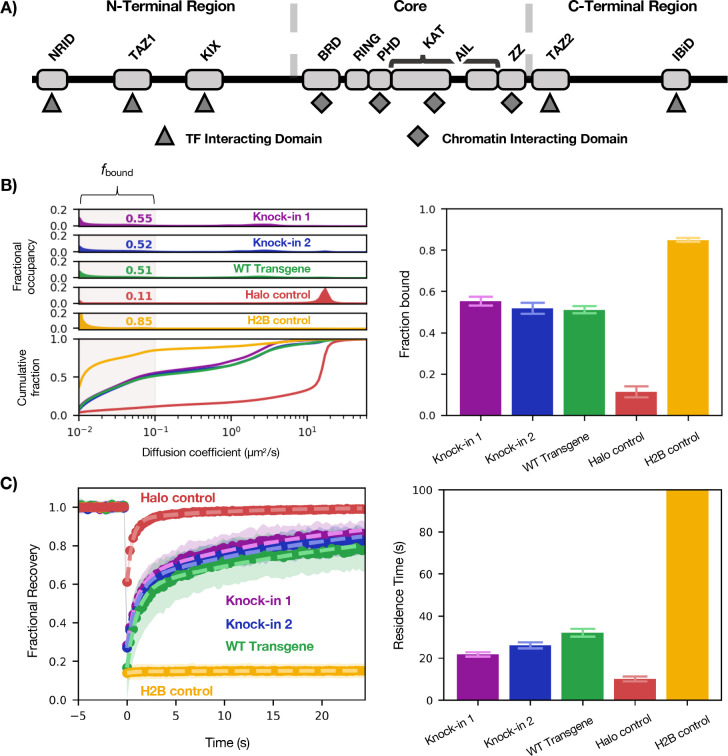
Figure 1— Benchmarking Halo-p300 diffusive behavior.
(A) Schematic of domain organization of p300 showing the TFIDs in the NTR and CTR and ChIDs in the Core. The black line indicates IDRs. Relative lengths are not to scale. (B) Diffusive spectra (left)—probability density function (top) and cumulative distribution function (bottom)—with plot of fbound (right). Bars represent bootstrapping mean ± SD. (C) FRAP curves of the same (left) with residence times plotted for each construct (right). Bars represent best fit ± 95% CI.

