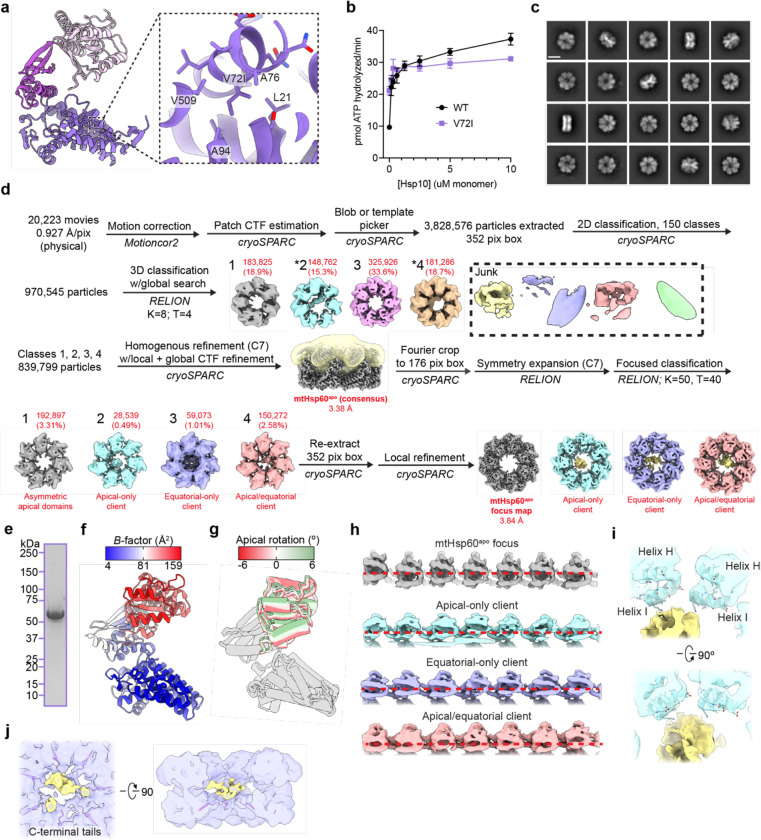
Extended Data Fig. 1. Biochemical and cryo-EM analysis of apo mtHsp60V72I.
(a) View of V72I mutation in mtHsp60apo, colored as in Fig. 1b. Adjacent hydrophobic residues also labeled. (b) Steady-state ATPase activity of mtHsp60 (black) and mtHsp60V72I (purple) as a function of mtHsp10 concentration. A representative experiment of three biological replicates is shown. Error bars represent standard deviation. (c) Representative 2D class averages from the mtHsp60apo dataset. Scale bar equals 100 Å. (d) Cryo-EM processing workflow for structures obtained from the mtHsp60apo dataset. The mask used for focused classification is shown in transparent yellow with the consensus map. Client-containing maps from the initial 3D classification are indicated (*). (e) Coomassie Brilliant Blue-stained SDS-PAGE gel of recombinant mtHsp60V72I, showing no strong additional bands corresponding to other proteins. (f) Protomer of apo mtHsp60 consensus colored by B-factor. (g) Overlay of mtHsp60apo focus protomers, with apical domains colored as in Fig. 1i. (h) Unwrapped views of unsharpened mtHsp60apo focus and client-bound maps, showing apical domain asymmetry. Horizontal red dashed lines are for clarity. (i) Enlarged view of apical domain helices H and I from the mtHsp60apo apical-only client map. (j) Enlarged view of resolved portions of C-terminal tails from the mtHsp60apo equatorial-only client map.

