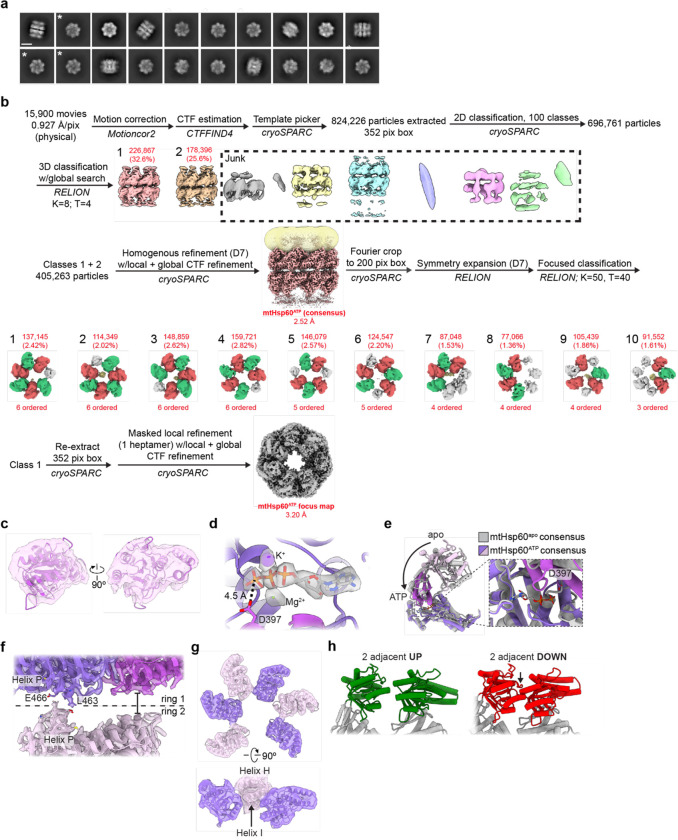
Extended Data Fig. 3. Cryo-EM analysis of ATP-bound mtHsp60V72I.
(a) Representative 2D class averages from the mtHsp60ATP dataset. Scale bar equals 100 Å. Top views of single ring complexes are indicated (*). (b) Cryo-EM processing workflow for structures obtained from the mtHsp60ATP dataset. The mask used for focused classification is shown in transparent yellow with the consensus map. Protomers from focused classification maps are colored in green (apical domain facing upward), red (apical domain facing downward), or gray (disordered apical domain). Class 1 was selected for refinement based on visual assessment of map quality. (c) View of an apical domain from the unsharpened mtHsp60ATP consensus map and associated model. (d) Nucleotide binding pocket of mtHsp60ATP, showing density for ATP and the γ-phosphate thereof, and Mg2+ and K+ ions (gray, from sharpened map). (e) Overlay of consensus mtHsp60apo and mtHsp60ATP models, aligned by the equatorial domain, showing a downward rotation of the intermediate and apical domains in the ATP-bound state. (f) Inter-ring interface of the sharpened mtHsp60ATP consensus map and fitted model, showing contact at the left interface mediated by helix P, but no contact at the right interface. Each protomer is colored a different shade of purple. (g) Unsharpened map and model of apical domains of mtHsp60ATP focus. ‘Down’ protomers are colored purple, ‘up’ protomers are colored pink. (h) Modeling of two adjacent ATP-bound ‘up’ (left) or ‘down’ (right) protomers, generated by aligning a copy of chain C of mtHsp60ATP focus with chain D (up pair) or a copy of chain D with chain C (down pair). A large clash is observed with two adjacent down protomers, while two adjacent up protomers appear compatible.

