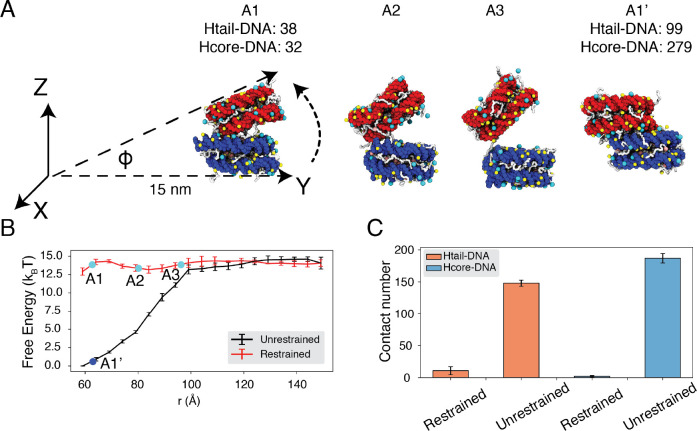
Figure 4: Close contacts give rise to strong internucleosomal interactions.
(A) Illustration of the simulation protocol employed to mimic the nucleosome unbinding pathway dictated by the DNA origami device.44 The three configurations, A1, A2, and A3, corresponding to the three cyan dots in part B at distances 62.7, 80.2, and 96.3Å. For comparison, a tightly bound configuration uncovered in simulations without any restraints of nucleosome movement is shown as A1’. The number of contacts formed by histone tails and DNA (Htail-DNA) and by histone core and DNA (Hcore-DNA) from different nucleosomes are shown for A1 and A1’. (B) Free energy profile as a function of the distance between the geometric centers of the two nucleosomes, computed from unrestrained (black) and DNA origami-restrained simulations (red). Error bars were computed as the standard deviation of three independent estimates. (C) Average inter-nucleosomal contacts between DNA and histone tail (orange) and core (blue) residues, computed from unrestrained and DNA origami-restrained simulations. Error bars were computed as the standard deviation of three independent estimates.

