Figure 2:
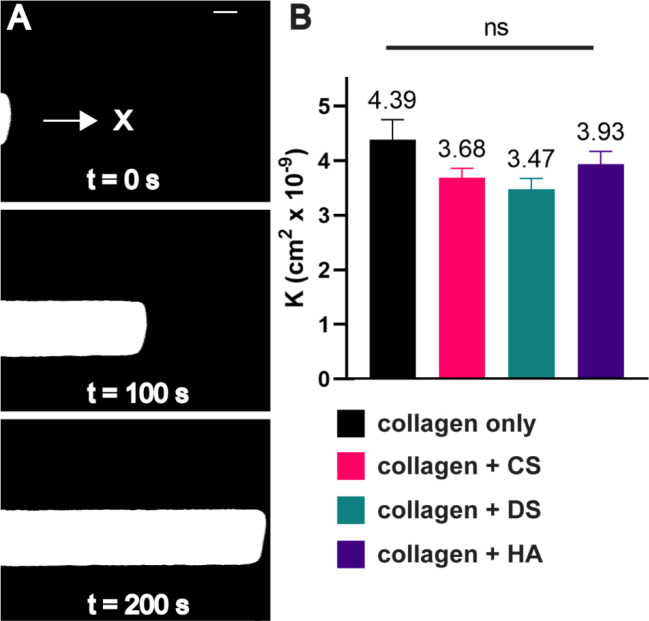
Hydraulic permeability measurements of GAG modified collagen matrices. A) Time-lapse microscopy is used to track a TRITC dye in a microfluidic channel to obtain the velocity of the flow. B) The addition of HA, CS, or DS fails to decrease hydraulic permeability (K). Scale bar = 200 μm. Error bars denote SEM. NS is non-significant ANOVA for all conditions tested.

