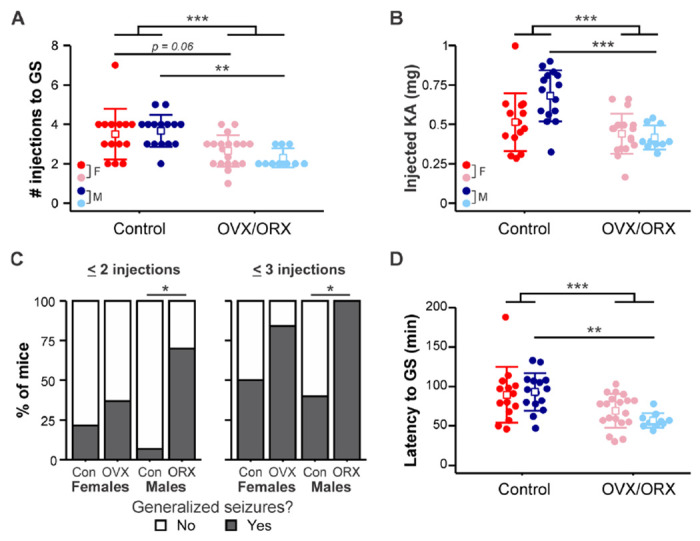
Figure 2. Effect of gonadectomy on susceptibility to GS is most prominent in males.

A) Individual values (circles) and mean ± SD (squares and lines, respectively) for the number of i.p. kainic acid injections needed to reach GS (GS). Raw data are presented; for statistical analysis, the data were log-transformed to improve normality. B) Individual values and mean ± SD for the total amount of KA injected to initiate GS. C) Percentage of mice in each group with at least one GS by two (left) or three (right) KA injections. D) Individual values and mean ± SD for the latency in minutes to reach GS. Raw data are presented; for statistical analysis, the data were square root-transformed to improve normality. Red = control females (F); blue = control males (M); pink = OVX females; light blue = ORX males. *p<0.05, **p<0.01, ***p<0.001
