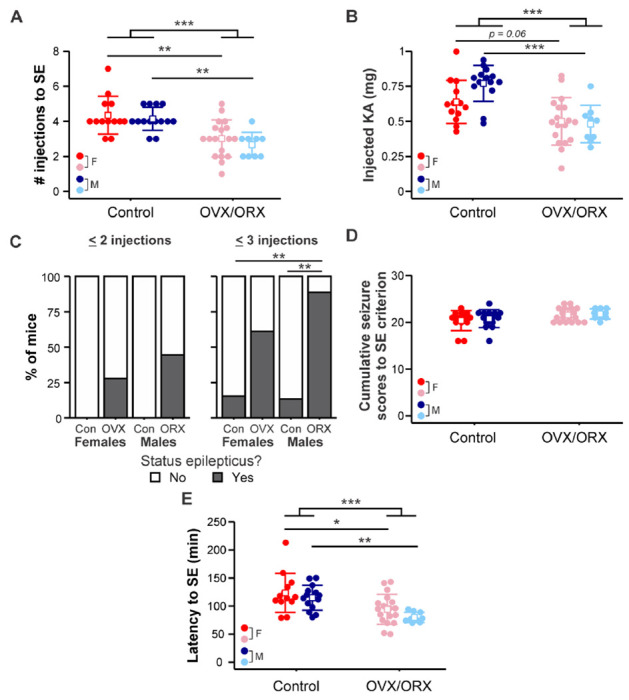
Figure 3. OVX females and ORX males exhibit increased susceptibility to status epilepticus (SE).

A) Individual values (circles) and mean ± SD (squares and lines, respectively) for the number of kainic acid injections needed to reach SE. B) Individual values and mean ± SD for the total amount of KA injected to initiate SE. Raw data are presented; for statistical analysis, the data were log-transformed to improve normality. C) Percentage of mice in each group that developed SE by two (left) or three (right) KA injections. D) Individual values and mean ± SD for the cumulative Racine scores of the first 5 GS (i.e., to SE criterion). Raw data are presented; for statistical analysis, the data were log-transformed to improve normality. E) Individual values and mean ± SD for the latency in minutes to reach SE. Raw data are presented; for statistical analysis, the data were square root-transformed to improve normality. Red = control females (F); blue = control males (M); pink = OVX females; light blue = ORX males. *p<0.05, **p<0.01, ***p<0.001
