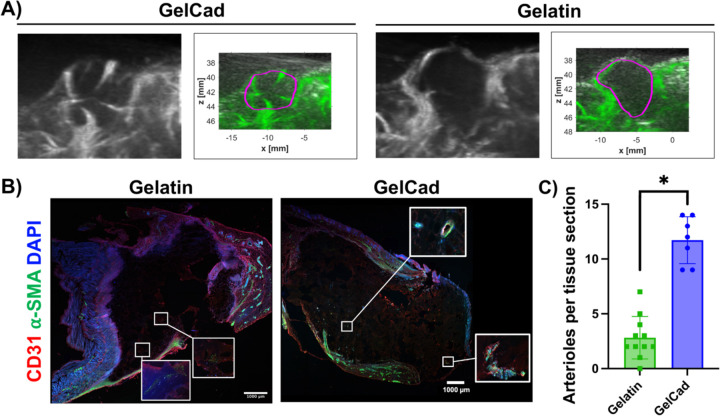
Figure 3: Evaluation of arteriole development in GelCad hydrogels after injection in mouse fat pad.
A) Representative images of contrast enhanced ultrasound at day 7. The black and white B-mode images show the boundaries of the mouse body, and the Power Doppler images in green highlight the vasculature. The purple boundary marks the estimated boundaries of the hydrogel. The full set of images can be found in Supplemental Figure 2.
B) Representative images of cryosectioned hydrogels that were extracted at day 14. The insets provide higher magnification of areas with α-SMA to highlight weaker, more diffuse signal in gelatin relative to GelCad hydrogels.
C) Quantification of arterioles per tissue section in each condition. Each data point represents an individual tissue section, and data are presented as mean ± SD from N=2–3 biological replicates per condition. Statistical significance was calculated from a student’s paired t-test (*, p<0.05).

